产品描述

来源:
Mouse
应用:
ELISA 1:10000, WB 1:500-1:2000, IHC 1:200-1:1000, IF/ICC 1:200-1:1000, FCM 1:200-1:400
*The optimal dilutions should be determined by the end user.
*Tips:

WB: 适用于变性蛋白样本的免疫印迹检测. IHC: 适用于组织样本的石蜡(IHC-p)或冰冻(IHC-f)切片样本的免疫组化/荧光检测. IF/ICC: 适用于细胞样本的荧光检测. ELISA(peptide): 适用于抗原肽的ELISA检测.

反应:
Human, Mouse, Rat, Monkey
克隆:
Monoclonal [AFB1810]
特异性:
SIRT1 antibody detects endogenous levels of total SIRT1.
RRID:
AB_2833834
引用格式: Affinity Biosciences Cat# BF0189, RRID:AB_2833834.
偶联:
Unconjugated.
纯化:
Affinity-chromatography.
保存:
Mouse IgG1 in phosphate buffered saline (without Mg2+ and Ca2+), pH 7.4, 150mM NaCl, 0.02% sodium azide and 50% glycerol. Store at -20 °C. Stable for 12 months from date of receipt.
别名:

展开/折叠

75SirT1; hSIR2; hSIRT1; HST2, S. cerevisiae, homolog of; NAD dependent deacetylase sirtuin 1; NAD dependent protein deacetylase sirtuin 1; OTTHUMP00000198111; OTTHUMP00000198112; Regulatory protein SIR2 homolog 1; SIR1_HUMAN; SIR2; SIR2 like 1; SIR2 like protein 1; SIR2, S.cerevisiae, homolog-like 1; SIR2-like protein 1; SIR2ALPHA; SIR2L1; Sirt1; SirtT1 75 kDa fragment; Sirtuin (silent mating type information regulation 2 homolog) 1 (S. cerevisiae); Sirtuin 1; Sirtuin type 1;

抗原和靶标

免疫原:

Purified recombinant fragment of human SIRT1 expressed in E. Coli.

基因/基因ID:
描述:
This gene encodes a member of the sirtuin family of proteins, homologs to the yeast Sir2 protein. Members of the sirtuin family are characterized by a sirtuin core domain and grouped into four classes. The functions of human sirtuins have not yet been determined; however, yeast sirtuin proteins are known to regulate epigenetic gene silencing and suppress recombination of rDNA. Studies suggest that the human sirtuins may function as intracellular regulatory proteins with mono-ADP-ribosyltransferase activity. The protein encoded by this gene is included in class I of the sirtuin family. [provided by RefSeq]

研究领域

· Cellular Processes > Cell growth and death > Cellular senescence.   (View pathway)

· Environmental Information Processing > Signal transduction > FoxO signaling pathway.   (View pathway)

· Environmental Information Processing > Signal transduction > AMPK signaling pathway.   (View pathway)

· Human Diseases > Substance dependence > Amphetamine addiction.

· Human Diseases > Cancers: Overview > MicroRNAs in cancer.

· Organismal Systems > Aging > Longevity regulating pathway.   (View pathway)

· Organismal Systems > Aging > Longevity regulating pathway - multiple species.   (View pathway)

· Organismal Systems > Endocrine system > Glucagon signaling pathway.

文献引用

1). Gene-Activating Framework Nucleic Acid-Targeted Upregulating Sirtuin-1 to Modulate Osteoimmune Microenvironment for Diabetic Osteoporosis Therapeutics. ACS nano, 2024 (PubMed: 39689347) [IF=15.8]

2). Dihydromyricetin regulates the miR-155-5p/SIRT1/VDAC1 pathway to promote liver regeneration and improve alcohol-induced liver injury. Phytomedicine : international journal of phytotherapy and phytopharmacology, 2025 (PubMed: 39986231) [IF=6.7]

3). HMGB 1 acetylation mediates trichloroethylene-induced immune kidney injury by facilitating endothelial cell-podocyte communication. Ecotoxicology and environmental safety, 2023 (PubMed: 37216866) [IF=6.2]

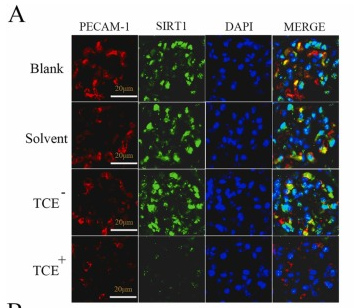
Application: IF/ICC    Species: Mouse    Sample: endothelial cells

Fig. 3. The SIRT 1 expression levels and cytoplasmic translocation of HMGB 1. A Immunofluorescence co-location results of SIRT 1 (× 400). B Immunofluorescence co-localization results of HMGB 1 (× 400). Red arrow: overlap between PECAM-1 and HMGB 1. C-F The expression levels of cytoplasmic and nuclear HMGB 1 were determined by Western blot. The protein bands of nuclear HMGB 1 (C), the average optical density value of nuclear HMGB 1 (D), The protein bands of cytoplasmic HMGB 1 (E), the average optical density value of cytoplasmic HMGB 1 (F). G-I Serum SIRT 1, HMGB 1 and Ac-HMGB 1 levels were detected by ELISA. Level of serum SIRT 1 (G), level of serum HMGB 1 (H), level of serum Ac-HMGB 1 (I). J-L Renal Ac-HMGB 1 and SIRT 1 levels were detected by western blot. The protein bands of SIRT 1 and Ac-HMGB 1 (J), the average optical density value of SIRT 1 (K), the average optical density value of Ac-HMGB 1 (L). * p 

4). 海马胰岛素抵抗与糖尿病诱发认知功能障碍中的Sirtuin 1信号通路. 中国神经再生研究(英文版), 2021 [IF=5.9]

Application: WB    Species: Rat    Sample:

Figure 6 | Intranasal insulin administration alters cognitive dysfunction and activates insulin signaling. (A) Schematic diagram of the experimental schedule. After 8 weeks of diabetes, diabetic rats were treated with insulin or vehicle for 6 weeks, and rat behaviors were investigated by the MWM (n = 15 per group). (B–E) Learning functions were evaluated by the escape latency time over 4 days (B). The latency time on days 2 (C), 3 (D), and 4 (E) were analyzed. (F–H) The memory functions of rats were assessed by the time spent in the target quadrant (F), the number of times that the rats crossed the expected platform location (G), and the percentage of distance in the target quadrant (H). (I–L) Protein expression levels were examined (n = 6 per group). Insulin administration increased the expression of p-IR (optical density ratio to IR) (J), p-IRS-1 (optical density ratio to IRS-1) (K), and SIRT1 (optical density ratio to GAPDH) (L) in the hippocampus of diabetic rats with cognitive decline. Data are presented as the mean ± SEM. *P < 0.05, **P < 0.01 (one-way analysis of variance). The experiments were repeated 3 times. DIA: Diabetic rats; GAPDH: glyceraldehyde- 3-phosphate dehydrogenase; IR: insulin receptor; IRS-1: IR receptor substrate 1; MWM: Morris water maze test; NS: non-streptozotocin rats; p-IR: phospho-insulin receptor; p-IRS-1: phospho-insulin receptor substrate; SIRT1: Sirtuin 1.

5). Hippocampal insulin resistance and the Sirtuin 1 signaling pathway in diabetes-induced cognitive dysfunction. Neural Regeneration Research, 2021 (PubMed: 33907035) [IF=5.9]

6). Ginsenoside Rc Alleviates Myocardial Ischemia-Reperfusion Injury by Reducing Mitochondrial Oxidative Stress and Apoptosis: Role of SIRT1 Activation. Journal of Agricultural and Food Chemistry, 2023 (PubMed: 36626267) [IF=5.7]

7). ADRB2 serves as a novel biomarker and attenuates alcoholic hepatitis via the SIRT1/PGC-1α/PPARα pathway: integration of WGCNA, machine learning and experimental validation. Frontiers in pharmacology, 2024 (PubMed: 39640486) [IF=5.6]

Application: WB    Species: Mouse    Sample: liver tissues

Figure 8. Low expression of ADRB2, SIRT1, PGC-1α, and PPARα in ethanol-induced alcoholic hepatitis. (A) Western blot analysis of ADRB2 in NIAAA mouse liver tissues. (B) Statistical results of NIAAA mouse liver western blot analysis. (C) Immunofluorescence of ADRB2 and SIRT1 in NIAAA mouse liver tissue. (D) Western blot analysis of ADRB2, PPARα, PGC-1α, and SIRT1 in ALD mouse liver tissues. (E) Statistical results of ALD mouse liver western blot analysis. (F) Immunofluorescence of ADRB2 and SIRT1 in ALD mouse liver tissue. * Represents p < 0.05 and ** represents p < 0.01, compared with the control group.

Application: IF/ICC    Species: Mouse    Sample: liver tissues

Figure 8. Low expression of ADRB2, SIRT1, PGC-1α, and PPARα in ethanol-induced alcoholic hepatitis. (A) Western blot analysis of ADRB2 in NIAAA mouse liver tissues. (B) Statistical results of NIAAA mouse liver western blot analysis. (C) Immunofluorescence of ADRB2 and SIRT1 in NIAAA mouse liver tissue. (D) Western blot analysis of ADRB2, PPARα, PGC-1α, and SIRT1 in ALD mouse liver tissues. (E) Statistical results of ALD mouse liver western blot analysis. (F) Immunofluorescence of ADRB2 and SIRT1 in ALD mouse liver tissue. * Represents p < 0.05 and ** represents p < 0.01, compared with the control group.

8). Treadmill Exercise Improves PINK1/Parkin-Mediated Mitophagy Activity Against Alzheimer’s Disease Pathologies by Upregulated SIRT1-FOXO1/3 Axis in APP/PS1 Mice. MOLECULAR NEUROBIOLOGY, 2023 (PubMed: 36261693) [IF=4.6]

9). Resveratrol ameliorates triglyceride accumulation through FXR deacetylation in high glucose-treated HepG2 cells. Journal of Functional Foods, 2023 [IF=3.8]

Application: WB    Species: Human    Sample: HepG2 cells

Fig. 1. The expression of Sirt1 involved in lipid accumulation in HG-induced HepG2 cells. (A) The effects of glucose concentration (25, 30, 35, 40, 45, 50, 55, 60, 70, 80 and 90 mM) on viability of HepG2 cells by MTT. (B) The effects of induced time (0, 12, 24, 48, 72 and 96 h) exposed to 60 mM glucose on the viability of HepG2 cells by MTT. (C) The TG and T-CHO levels in HepG2 cells exposed to 25 mM, 45 mM and 60 mM glucose for 48 h. (D) The TG and T-CHO levels in HepG2 cells exposed to 60 mM glucose for 0 h, 24 h and 48 h. (E) Oil Red O staining in different groups of HepG2 cells. (F, G) The relative protein levels and distribution of Sirt1 in HepG2 cells exposed to 25 mM, 45 mM and 60 mM glucose for 48 h. (H, I) The relative protein levels and distribution of Sirt1 in HepG2 cells exposed to 60 mM glucose for 0 h, 24 h and 48 h. Each bar represents the mean ± SEM for groups of three. *P < 0.05, **P < 0.01, compared to 0 h or 25 mM as indicated.

Application: IF/ICC    Species: Human    Sample: HepG2 cells

Fig. 1. The expression of Sirt1 involved in lipid accumulation in HG-induced HepG2 cells. (A) The effects of glucose concentration (25, 30, 35, 40, 45, 50, 55, 60, 70, 80 and 90 mM) on viability of HepG2 cells by MTT. (B) The effects of induced time (0, 12, 24, 48, 72 and 96 h) exposed to 60 mM glucose on the viability of HepG2 cells by MTT. (C) The TG and T-CHO levels in HepG2 cells exposed to 25 mM, 45 mM and 60 mM glucose for 48 h. (D) The TG and T-CHO levels in HepG2 cells exposed to 60 mM glucose for 0 h, 24 h and 48 h. (E) Oil Red O staining in different groups of HepG2 cells. (F, G) The relative protein levels and distribution of Sirt1 in HepG2 cells exposed to 25 mM, 45 mM and 60 mM glucose for 48 h. (H, I) The relative protein levels and distribution of Sirt1 in HepG2 cells exposed to 60 mM glucose for 0 h, 24 h and 48 h. Each bar represents the mean ± SEM for groups of three. *P < 0.05, **P < 0.01, compared to 0 h or 25 mM as indicated.

10). Taohong Siwu Decoction improves cerebral ischemia–reperfusion injury through SIRT1/FOXO1 signaling pathway. Journal of Functional Foods, 2024 [IF=3.8]

Application: WB    Species: Rat    Sample:

Fig. 7. Effect of THSWD on SIRT1/FOXO1 pathway in MCAO/R rats and OGD/R PC12 cells (A) SIRT1/FOXO1 pathway protein expression in MCAO/R rats; (B-D) Expression of SIRT1, FOXO1 and Ac-FOXO1 proteins in MCAO/R rats; (E) Protein expression of SIRT1/FOXO1 pathway in OGD/R PC12 cells; (F-H) Expression of SIRT1, FOXO1 and Ac-FOXO1 proteins in OGD/R PC12 cells. (n = 3, #P < 0.05 vs Sham; ##P < 0.01 vs Sham or Control; *P < 0.05 vs Model or OGD/R; **P < 0.01 vs Model or OGD/R).

限制条款

产品的规格、报价、验证数据请以官网为准,官网链接:www.affbiotech.com | www.affbiotech.cn(简体中文)| www.affbiotech.jp(日本語)

产品的数据信息为Affinity所有,未经授权不得收集Affinity官网数据或资料用于商业用途,对抄袭产品数据的行为我们将保留诉诸法律的权利。

产品相关数据会因产品批次、产品检测情况随时调整,如您已订购该产品,请以订购时随货说明书为准,否则请以官网内容为准,官网内容有改动时恕不另行通知。

Affinity保证所销售产品均经过严格质量检测。如您购买的商品在规定时间内出现问题需要售后时,请您在Affinity官方渠道提交售后申请。

产品仅供科学研究使用。不用于诊断和治疗。 

产品未经授权不得转售。

Affinity Biosciences将不会对在使用我们的产品时可能发生的专利侵权或其他侵权行为负责。Affinity Biosciences, Affinity Biosciences标志和所有其他商标所有权归Affinity Biosciences LTD.