产品: LCN2 抗体
货号: DF6816
描述: Rabbit polyclonal antibody to LCN2
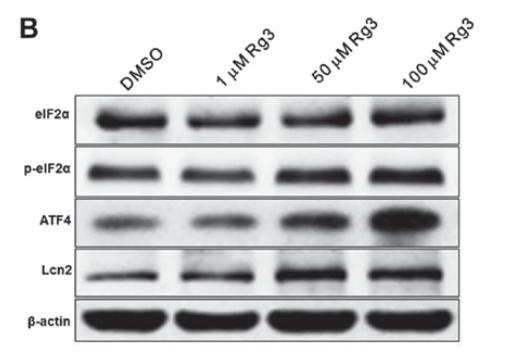
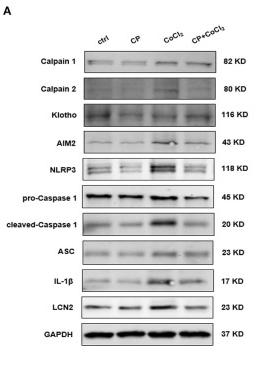
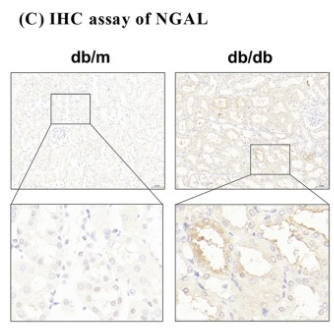
应用: WB IHC
文献验证: WB, IHC
反应: Human, Mouse, Rat
分子量: 23kDa; 23kD(Calculated).
蛋白号: P80188
RRID: AB_2838777

浏览相似产品>>

   规格 价格 库存
 50ul RMB¥ 1250 现货
 100ul RMB¥ 2300 现货
 200ul RMB¥ 3000 现货

货期: 当天发货

联系销售

产品描述

来源:
Rabbit
应用:
WB 1:500-1:2000, IHC 1:50-1:200
*The optimal dilutions should be determined by the end user.
*Tips:

WB: 适用于变性蛋白样本的免疫印迹检测. IHC: 适用于组织样本的石蜡(IHC-p)或冰冻(IHC-f)切片样本的免疫组化/荧光检测. IF/ICC: 适用于细胞样本的荧光检测. ELISA(peptide): 适用于抗原肽的ELISA检测.

反应:
Human, Mouse, Rat
克隆:
Polyclonal
特异性:
LCN2 Antibody detects endogenous levels of total LCN2.
RRID:
AB_2838777
引用格式: Affinity Biosciences Cat# DF6816, RRID:AB_2838777.
偶联:
Unconjugated. 130
纯化:
The antiserum was purified by peptide affinity chromatography using SulfoLink™ Coupling Resin (Thermo Fisher Scientific).
保存:
Rabbit IgG in phosphate buffered saline , pH 7.4, 150mM NaCl, 0.02% sodium azide and 50% glycerol. Store at -20 °C. Stable for 12 months from date of receipt.
别名:

展开/折叠

24p3; 25 kDa alpha 2 microglobulin related subunit of MMP9; 25 kDa alpha-2-microglobulin-related subunit of MMP-9; Alpha 2 microglobulin related protein; HGNC:6526; HNL; Lcn 2; Lcn2; Lipocalin-2; Migration stimulating factor inhibitor; MSFI; Neutrophil gelatinase associated lipocalin; Neutrophil gelatinase associated lipocalin precursor; Neutrophil gelatinase-associated lipocalin; NGAL; NGAL_HUMAN; Oncogene 24p3; Oncogenic lipocalin 24p3; p25; Siderocalin; siderocalin LCN2; SV40 induced 24P3 protein; Uterocalin;

抗原和靶标

免疫原:
Uniprot:
基因/基因ID:
表达:
P80188 NGAL_HUMAN:

Detected in neutrophils (at protein level) (PubMed:7683678, PubMed:8298140). Expressed in bone marrow and in tissues that are prone to exposure to microorganism. High expression is found in bone marrow as well as in uterus, prostate, salivary gland, stomach, appendix, colon, trachea and lung. Not found in the small intestine or peripheral blood leukocytes.

描述:
Lipocalin-2, a member of the lipocalin family of proteins, was originally identified as a gelatinase-associated component of neutrophil secretory granules (1). Lipocalin-2 is involved in innate immunity, iron homeostasis, and apoptosis. Lipocalin-2 limits bacterial growth by binding to bacterial siderophores and sequestering iron (2-4). In mammalian cells, iron-loaded lipocalin-2 binds to its receptor, 24p3R, and is internalized, thereby releasing iron and increasing the intracellular iron concentration (5). Conversely, iron-free lipocalin-2 promotes apoptosis (5). Lipocalin-2 is also expressed in adipose tissue and promotes insulin resistance in cultured mouse adipocytes (6).
序列:
MPLGLLWLGLALLGALHAQAQDSTSDLIPAPPLSKVPLQQNFQDNQFQGKWYVVGLAGNAILREDKDPQKMYATIYELKEDKSYNVTSVLFRKKKCDYWIRTFVPGCQPGEFTLGNIKSYPGLTSYLVRVVSTNYNQHAMVFFKKVSQNREYFKITLYGRTKELTSELKENFIRFSKSLGLPENHIVFPVPIDQCIDG

研究背景

功能:

Iron-trafficking protein involved in multiple processes such as apoptosis, innate immunity and renal development. Binds iron through association with 2,5-dihydroxybenzoic acid (2,5-DHBA), a siderophore that shares structural similarities with bacterial enterobactin, and delivers or removes iron from the cell, depending on the context. Iron-bound form (holo-24p3) is internalized following binding to the SLC22A17 (24p3R) receptor, leading to release of iron and subsequent increase of intracellular iron concentration. In contrast, association of the iron-free form (apo-24p3) with the SLC22A17 (24p3R) receptor is followed by association with an intracellular siderophore, iron chelation and iron transfer to the extracellular medium, thereby reducing intracellular iron concentration. Involved in apoptosis due to interleukin-3 (IL3) deprivation: iron-loaded form increases intracellular iron concentration without promoting apoptosis, while iron-free form decreases intracellular iron levels, inducing expression of the proapoptotic protein BCL2L11/BIM, resulting in apoptosis (By similarity). Involved in innate immunity; limits bacterial proliferation by sequestering iron bound to microbial siderophores, such as enterobactin. Can also bind siderophores from M.tuberculosis.

细胞定位:

Secreted. Cytoplasmic granule lumen. Cytoplasmic vesicle lumen.
Note: Upon binding to the SLC22A17 (24p3R) receptor, it is internalized (By similarity). Releases the bound iron in the acidic lumen of cytoplasmic vesicles (PubMed:12453413, PubMed:20581821).

Extracellular region or secreted Cytosol Plasma membrane Cytoskeleton Lysosome Endosome Peroxisome ER Golgi apparatus Nucleus Mitochondrion Manual annotation Automatic computational assertionSubcellular location
组织特异性:

Detected in neutrophils (at protein level). Expressed in bone marrow and in tissues that are prone to exposure to microorganism. High expression is found in bone marrow as well as in uterus, prostate, salivary gland, stomach, appendix, colon, trachea and lung. Not found in the small intestine or peripheral blood leukocytes.

亚基结构:

Monomer. Homodimer; disulfide-linked. Heterodimer; disulfide-linked with MMP9.

蛋白家族:

Belongs to the calycin superfamily. Lipocalin family.

研究领域

· Organismal Systems > Immune system > IL-17 signaling pathway.   (View pathway)

文献引用

1). Passively-targeted mitochondrial tungsten-based nanodots for efficient acute kidney injury treatment. Bioactive materials, 2023 (PubMed: 36185743) [IF=18.9]

Application: WB    Species: Mouse    Sample:

Fig. 4 TWNDs reduced mitochondrial-dependent apoptosis. (A–B) TEM image of mitochondria of tubular cells in normal mouse (A) and AKI mouse (B). Scale bar: 1 μm. (C) Schematic illustration of TWNDs passing through the glomerulus to the tubular site. (D) TEM image of mitochondria of tubule cells in AKI mouse after injection of TWNDs and the magnified image. Scale bar: 1 μm. (E) Schematic illustration of ROS induced mitochondrial-dependent cell apoptosis. (F) WB analysis of BAX, BCL-2, Cyt c, KIM-1 and NGAL proteins in renal tissue homogenate from each group. (G) Quantification of the protein immunoblots of BAX, BCL-2, Cyt c, KIM-1 and NGAL. (H) MitoSOX staining (red fluorescence), DAPI (blue fluorescence) staining, and their merge images of HK-2 cells from each group. Scale bar: 10 μm. (I) Quantification of MitoSOX-positive cells in (H). (J) TUNEL staining (green fluorescence), DAPI (blue fluorescence) staining, and their merge images of kidney tissues from each group. Scale bar: 100 μm. (K) Quantification of TUNEL-positive cells in (J). (L) Immunohistochemical staining of Cyt c from each group. Scale bar: 20 μm. (M) Quantification of Cyt-c-positive rate in (L). Data represent means ± S.D. from at least three independent replicates. (*P < 0.05, **P < 0.01, ***P < 0.001 vs AKI or H2O2 group; ##P < 0.01, ###P < 0.001vs sham or control group).

2). Rescue RM/CS-AKI by blocking strategy with one-dose anti-myoglobin RabMAb. Nature Communications, 2025 [IF=15.7]

Application: IHC    Species: Mouse    Sample: kidney tissue

Fig. 2. Anti-Mb RabMAb alleviates kidney injury of RM/CS-AKI mice by decreasing Mb accumulation. a Experimental design diagram of anti-Mb RabMAb treatment for RM/CS-AKI model mouse. b, c Survival rate curves of each group of mice within 72 h. The cumulative incidence estimate was used to calculate the probability of survival rate as a function of time. The log-rank test was used to compare survival curves. n = 20 for biological replicates. d, e WB detection of NGAL expression and Mb accumulation in the kidneys in each group. GAPDH was used as the loading control. n = 3 biological replicates for each group. f, g Immunofluorescence staining detected the Mb distribution and contents in the kidney tissue. The nuclei were stained with DAPI (blue). The lotus tetragonolobus lectin (LTL, green) labeled brush border showed the proximal tubule contour. h, i Immunohistochemistry staining detected the distribution of Mb, NGAL, and KIM-1 in the kidney tissue. n = 3 for biological replicates. j, k Mb concentration in mouse serum. l, m, p, q Representative images of transcutaneous disappearance curves of FITC-sinistrin excretion at 24 h and 72 h. The x-axis represents time, and the y-axis represents the relative transcutaneous fluorescence. n, r Terminal half-life (T1/2) of FITC-sinistrin excretion. o, s GFR values of each group of mice were calculated from the excretion T1/2 of FITC-sinistrin. Graph bars represent mean ± SD, and dots indicate individual data points for n = 6 for biological replicates per group in (j, k, n, o, r, s). Two-way ANOVA for (j, k, n, o, r, s) followed by Tukey’s multiple comparisons test were used to identify the differences. * p 

Application: WB    Species: Mouse    Sample: kidney tissue

Fig. 2. Anti-Mb RabMAb alleviates kidney injury of RM/CS-AKI mice by decreasing Mb accumulation. a Experimental design diagram of anti-Mb RabMAb treatment for RM/CS-AKI model mouse. b, c Survival rate curves of each group of mice within 72 h. The cumulative incidence estimate was used to calculate the probability of survival rate as a function of time. The log-rank test was used to compare survival curves. n = 20 for biological replicates. d, e WB detection of NGAL expression and Mb accumulation in the kidneys in each group. GAPDH was used as the loading control. n = 3 biological replicates for each group. f, g Immunofluorescence staining detected the Mb distribution and contents in the kidney tissue. The nuclei were stained with DAPI (blue). The lotus tetragonolobus lectin (LTL, green) labeled brush border showed the proximal tubule contour. h, i Immunohistochemistry staining detected the distribution of Mb, NGAL, and KIM-1 in the kidney tissue. n = 3 for biological replicates. j, k Mb concentration in mouse serum. l, m, p, q Representative images of transcutaneous disappearance curves of FITC-sinistrin excretion at 24 h and 72 h. The x-axis represents time, and the y-axis represents the relative transcutaneous fluorescence. n, r Terminal half-life (T1/2) of FITC-sinistrin excretion. o, s GFR values of each group of mice were calculated from the excretion T1/2 of FITC-sinistrin. Graph bars represent mean ± SD, and dots indicate individual data points for n = 6 for biological replicates per group in (j, k, n, o, r, s). Two-way ANOVA for (j, k, n, o, r, s) followed by Tukey’s multiple comparisons test were used to identify the differences. * p 

3). Internalized polystyrene nanoplastics trigger testicular damage and promote ferroptosis via CISD1 downregulation in mouse spermatocyte. JOURNAL OF NANOBIOTECHNOLOGY, 2025 [IF=12.6]

Application: WB    Species: Mouse    Sample: GC-2 cells

Fig. 3 PS-NPs initiate ferroptosis by triggering iron overload and ROS overproduction in GC-2 cells. (A) Various concentrations of PS-NPs (50 µg/mL, 100 µg/mL, 200 µg/mL) in different treatment times (6–24 h) reduce cell viability in GC-2 cells. (B and C) Representative images and quantification of fluorescence intensity for lipid peroxidation levels labelled with C11 BODIPY in GC-2 cells post-exposed with PS-NPs. Statistical analysis presented the ratio of MFI of green to red. (D-F) The levels of MDA, GSH, and total Fe were detected in GC-2 cells after PS-NPs treatment for 12 h. (G and H) Representative images and quantification of fluorescence intensity showing intracellular chelatable iron in GC-2 cells post-exposure to PS-NPs labelled with FerroOrange (red). (I and J) DCFH-DA staining was performed to detect ROS levels of GC-2 cells after PS-NPs exposure for 12 h using fluorescent microscopy. (K) Flow cytometry analysis of and ROS levels of GC-2 cells after PS-NPs exposure for 12 h using Fluorescence-activated cell sorting (FACS). (L) qRT-PCR analysis of ferroptosis-related gene expression in GC-2 cells treated with or without PS-NPs. (M and N) Ferroptosis-related proteins in GC-2 cells stimulated by PS-NPs were determined by western blotting. And semi-quantification of protein expression levels normalized to β-actin. (O) Representative TEM images depicting mitochondria in GC-2 cells in response to exposure to PS-NPs. The reduction of mitochondrial cristae is denoted by yellow arrows, while red arrows signify mitochondrial membrane rupture. (P and Q) Representative illustration and quantification of fluorescence intensity depicting mitochondria in GC-2 cells after treatment with PS-NPs using Mito-Tracker Green. (R and S) Illustration and quantification data of mitochondrial membrane potential in GC-2 cells in response to treatment of PS-NPs stained with TMRE

4). Silibinin attenuates ferroptosis in acute kidney injury by targeting FTH1. Redox biology, 2024 (PubMed: 39326069) [IF=10.7]

Application: IHC    Species: Mouse    Sample: kidney

Fig. 1. Silibinin protects against renal dysfunction and pathological damage in IRI-AKI mice. (A) Chemical structure of silibinin (from PubChem Compound Database). (B) The schematic diagram of experimental design. (C–D) The BUN and Scr levels (n = 8). (E) Representative gross-morphological images of kidney cross section. (F, H) H&E and PAS staining of kidney sections, and renal injury score (n = 6, scale bar = 100 μm). (G, I-J) IHC sections and quantitative results of NGAL and Kim-1 staining (n = 6, scale bar = 100 μm). (K–L) Relative mRNA expression of NGAL and Kim-1 (n = 6). ###P < 0.001 versus the sham group; ∗P < 0.05, ∗∗P < 0.01, ∗∗∗P < 0.001 versus the model group.

5). Myoglobin promotes macrophage polarization to M1 type and pyroptosis via the RIG-I/Caspase1/GSDMD signaling pathway in CS-AKI. Cell Death Discovery, 2022 (PubMed: 35228524) [IF=7.0]

Application: IHC    Species: Mice    Sample: renal tissues

Fig. 7 DMF alleviated renal injury in CS-AKI mice. a Schematic diagram of experimental design of DMF treatment for CS-AKI mice. b, c qPCR analyses KIM-1 and NGAL mRNA level in the renal tissues of four groups (NC, CS, CS + DMF, DMF). d–g Concentration of biochemical indicators CK, myoglobin, SCr and BUN in serum. h Evaluation of the therapeutic effect of DMF on the kidney tissue of CS-AKI mice by HE staining (original magnification: 200×, scale bar: 100 μm). i IHC staining analyses the expression of NGAL in kidney tissues (original magnification: 200×, scale bar: 100 μm). For statistical analysis, one-way ANOVA followed by Tukey’s method for multiple comparisons used in (b–g). Data are expressed as mean ± SD, n = 3 per group. **P < 0.01, ***P < 0.001.

6). Puerarin suppresses macrophage M1 polarization to alleviate renal inflammatory injury through antagonizing TLR4/MyD88-mediated NF-κB p65 and JNK/FoxO1 activation. Phytomedicine : international journal of phytotherapy and phytopharmacology, 2024 (PubMed: 38905846) [IF=6.7]

7). Nephroprotective Effects of Cardamonin on Renal Ischemia Reperfusion Injury/UUO-Induced Renal Fibrosis. Journal of agricultural and food chemistry, 2023 (PubMed: 37646396) [IF=5.7]

8). Exosome‑encapsulated miR‑26a attenuates aldosterone‑induced tubulointerstitial fibrosis by inhibiting the CTGF/SMAD3 signaling pathway. International Journal of Molecular Medicine, 2023 (PubMed: 36524378) [IF=5.7]

Application: WB    Species: Mice    Sample: kidneys

Figure 1 miR-26a expression is downregulated in the kidneys of ALD-induced mice. (A) Representative images of Masson's trichrome stained kidney tissues of mice in the sham and ALD groups. Scale bar, 50 µm. (B) RT-qPCR analysis of miR-26a expression levels in the kidney tissues of mice in the sham and ALD groups; U6 was used for normalization. (C) RT-qPCR analysis of collagen I, α-SMA and LCN2 mRNA expression levels in the kidney tissues of mice from the sham and ALD groups; β-actin was used for normalization. (D) Representative western blotting images and semi-quantitative analysis of E-cadherin, collagen I, α-SMA, CTGF and LCN2 protein expression levels in the kidney tissue of mice in the sham and ALD groups. (E) Immunohistochemical analysis of E-cadherin (green), α-SMA (red) and fibronectin (green) in the kidney tissue of mice in the sham and ALD groups; DAPI (blue) was used to stain the nuclei. Scale bar, 50 µm. Data are presented as the mean ± SD; n=5 mice/group; *P<0.05 vs. sham. α-SMA, α-smooth muscle actin2; CTGF, connective tissue growth factor; LCN2, lipocalin; RT-qPCR, reverse transcription-quantitative PCR.

9). G-4 inhibits triple negative breast cancer by inducing cell apoptosis and promoting LCN2-dependent ferroptosis. Biochemical pharmacology, 2024 (PubMed: 38395264) [IF=5.3]

10). 17β-Trenbolone increases the release of lipocalin 2 via the brain‒liver axis and causes Alzheimer's disease-like symptoms in CSDS-induced mice. MOLECULAR NEUROBIOLOGY, 2025 [IF=5.1]

加载更多

限制条款

产品的规格、报价、验证数据请以官网为准,官网链接:www.affbiotech.com | www.affbiotech.cn(简体中文)| www.affbiotech.jp(日本語)

产品的数据信息为Affinity所有,未经授权不得收集Affinity官网数据或资料用于商业用途,对抄袭产品数据的行为我们将保留诉诸法律的权利。

产品相关数据会因产品批次、产品检测情况随时调整,如您已订购该产品,请以订购时随货说明书为准,否则请以官网内容为准,官网内容有改动时恕不另行通知。

Affinity保证所销售产品均经过严格质量检测。如您购买的商品在规定时间内出现问题需要售后时,请您在Affinity官方渠道提交售后申请。

产品仅供科学研究使用。不用于诊断和治疗。 

产品未经授权不得转售。

Affinity Biosciences将不会对在使用我们的产品时可能发生的专利侵权或其他侵权行为负责。Affinity Biosciences, Affinity Biosciences标志和所有其他商标所有权归Affinity Biosciences LTD.