


 and mouse anti-beta tubulin Ab(#T0023) for 1 hour at 37°C. An AlexaFluor594 conjugated goat anti-rabbit IgG Ab(Red) and an AlexaFluor488 conjugated goat anti-mouse IgG Ab(Green) were used as the secondary antibody.
The nuclear counter stain is DAPI (blue).")
 and mouse anti-beta tubulin Ab(T0023) for 1 hour at 37°C. An AlexaFluor594 conjugated goat anti-rabbit IgG(H+L) Ab(Red) and an AlexaFluor488 conjugated goat anti-mouse IgG(H+L) Ab(Green) were used as the secondary antibody.
The nuclear counter stain is DAPI (blue).")
 The expression of α-SMA and α-Ac-Tub in lung tissue measured by immunohistochemistry. Scale bar=200μm and 50μm. (b) The expression of col I, α-SMA and α-Ac-Tub in lung tissue measured by Western blot. Data presented as mean±SEM; N=4 independent experiments.")
 The expression of α-SMA and α-Ac-Tub in lung tissue measured by immunohistochemistry. Scale bar=200μm and 50μm. (b) The expression of col I, α-SMA and α-Ac-Tub in lung tissue measured by Western blot. Data presented as mean±SEM; N=4 independent experiments.")
 The coexpression of α-SMA and α-Ac-Tub in fibroblasts induced by Ang II measured by immunofluorescence. Scale bar=50μm. (b) Effect of Ac-SDKP, valsartan (AT1 inhibitor), TCS HDAC6 20b (specific HDAC6 inhibitor), and Y-27632 (ROCK inhibitor) on fibroblasts measured by Western blot. Data presented as mean±SEM; N=4 independent experiments.")
. BMFBs were pretreated with PD98059 2 h before the indicated treatments with 5 ng/ ml TGF-b1. b-actin was used as a loading control for each condition (B). The data shown represent one of three independent experiments.")
 Protein expression of meprin a, pro-COL I, TGF-b1, a-SMA, and MCP-1 was detected by western blotting and quantified. (B) Levels of miR-155-5p and Mep1a in rat
lungs. Data are presented as the mean ± SD. n = 5 per group. (C and D) Protein (C) and (D) mRNA (D) levels of meprin a in RAW264.7 cells treated with agomiR-155-5p or
antamiR-155-5p. (E) Luciferase reporter assay demonstrating Mep1a was a target of miR-155-5p. Data are presented as the mean ± SD. n = 3 per group")

 Representative immunofluorescence staining of vimentin (green), a-SMA (green), and CD31 of VICs. The positive staining of vimentin and negative staining of CD31
indicated the harvested cells were VICs. The nuclei were counterstained with 4’,6-diamidino-2-phenylindole (DAPI) (blue). Scale bar, 100 mm. (B–E) Quantitative real-time
PCR analysis of osteogenic markers of VICs after osteogenic induction in vitro:")
 of animals after PTL treatment. b Hydroxyproline content in lung tissues. c Western blot analysis of type I collagen (Col1) and α-SMA in lung tissues was performed. GAPDH was used as a loading control.")

 HE staining followed by quantitative analysis of proportion of plaque versus media. (B)
Masson staining and quantification of collagen fibrils relative expression in plaque and media. Immunohistochemistry staining for α-SMA (C) and CD68 (D) followed
by quantification in plaque and media. n = 5, Bars = 200 μm or 50 μm. Data are presented as mean ± SD. *P < 0.05, **P < 0.01, ***P < 0.001.")


 Representative bands of caspase‑3, cleaved‑caspase‑3, vimentin, α‑SMA and E‑cadherin protein expression in the individual groups.")
 and the presence or absence of TGF-b1 (5 ng/ml) for 24 h. (a and b) Real-time qPCR on related genes, including a-SMA and fibronectin. (c) Cell proliferation and apoptosis were measured by Western blot. Quantification of a-SMA and fibronectin expression is achieved using densitometric values as shown in(d).")
Immunohistochemistry for a-SMA and collagenI(Brownarea) in bleomycin-induced pulmonary fibrosis in mice on day 14. Representative images of lung sections from each group are shown.Dashed boxes on top panels indicate region shown at higher magnification in bottom panels.Magnification=9200(toppanels),9400(bottompanels).")
 Cell migration was assayed by Transwell assay in HG-induced MPC5 cells treated with miR-215-5p mimic. (b) The number of migratory cells was analyzed by ImageJ software. (c) The expression of miR215-5p was measured by qRT-PCR in HG-induced MPC5 cells treated with miR-215-5p mimic. (d) The expression of E-cadherin and a-SMA was measured by western blotting under miR-215-5p mimic treatment.")
 and α-SMA (red), and quantitative analysis of the staining intensity. Scale bar, 50 μm. Statistically significant differences are presented as the mean ± SD (n = 3)by one-way ANOVA with Tukey’s test for multiple comparisons.")
 Red O-solid green stains the cartilage matrix of 4 groups. (B) Apoptosis stained of 4 groups by TUNEL. (C) Western blot of 4 groups. WBV = whole-body vibration; TNF-α = tumor necrosis factor-α; DMM = destabilization medial meniscus; α-SMA = α-smooth muscle actin.")
 Protein levels of FGFR4, TGF-β1, α-SMA, and COL1A1 measured by western blot. LPS:lipopolysaccharides; NC: scramble-miR control. ∗P < 0:05, ∗∗P < 0:01, and ∗∗P < 0:001 versus control; #P < 0:05, ##P < 0:01,and ###P < 0:001 versus NC+LPS.")


. Scale bar,100 μm. B Representative immunoblots of Col IA/Col IIIA/α-SMA and summarized intensities of blots in the cortex and medulla (n = 6–8 per group).")
 Representative immunofluorescence results of CCSMCs show positive expression for α-SMA and desmin. Scale bars = 50 μm")
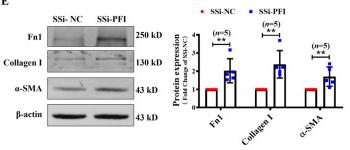
 Western blot analysis of the protein levels of Fn, Col1 and α-SMA in lung tissues.")
 Immunohistochemical staining of α-SMA, Col1 and Fn in lung tissues. Scale bar = 50 µm.")
 Protein expression of pro-COL I, α-SMA, TGF-βR I, TGF-βR II, and p-Smad2/3 was measured in lung fibroblasts treated with CM plus meprin α or actinonin. Data are presented as the mean ± SD. n = 3 per group. * Compared with control group, p < 0.05; # Compared with CM group, p < 0.05. (B) Expression of α-SMA in lung fibroblasts observed by IHC staining (Bar = 100 μm).")
 Kidney tissue lysates were subjected to immunoblot analysis with specific antibodies against E-cadherin, vimentin, α-SMA, or glyceraldehyde 3- phosphate dehydrogenase (GAPDH). (B) Expression levels of E-cadherin were quantified by densitometry and normalized to GAPDH. (C) Expression levels of vimentin were quantified by densitometry and normalized to GAPDH. (D) Expression levels of α-SMA were quantified by densitometry and normalized to GAPDH. (E) Photomicrographs (original magnification, ×400) illustrate immunohistochemical staining of E-cadherin and α-SMA in the kidney tissues. RGTZ, rosiglitazone. Data are represented as the mean ± SEM. *p < 0.05 vs sham group; #p < 0.05 vs sham + RGTZ group. **p < 0.05 vs HN group.")
 eNOS, CD31 and α-SMA expression in HUVECs subjected to TGF-β and BHB for 48 h were measured with western blot. The quantified eNOS, CD31 and α-SMA
levels are presented in (B-D). (E-I) The ERK and NF-κB signaling pathway and related inflammatory cytokine were measured with western blot. (J) Inhibition of NFκB prevented the effect of ketone body and TGF-β on eNOS expression in HUVECs. (K-M) Quantification of eNOS, CD31 and α-SMA. All data are expressed as a
mean ± SEM. n = 6 per group. *P < 0.05; **P < 0.01; BHB, β-hydroxybutyrat; HUVECs, human umbilical vein endothelial cells; TGF-β, transforming growth
factor-β.")
 (x200) of Control group showing minimal positive staining for α smooth muscle actin; CCl4 group showing diffuse positive staining for α smooth muscle actin which is marked around portal tract(Blue arrow);CCl4+Linagliptin group showing mild positive staining for α smooth muscle actin; CCl4+Silymarin group showing mild positive staining for α smooth muscle actin; Linagliptin group showing mild positive staining for α smooth muscle actin; Page 27 of 35 Can. J. Physiol. Pharmacol.Downloaded from www.nrcresearchpress.com by Univ of Massachusetts on 08/02/20. For personal use only. 28 Percentage of α-SMA positive immunostaining. Data are expressed as mean ± SEM (Control n=10, CCl4 n=10, CCl4+ Linagliptin n=7, CCl4+Silymarin n = 7, Linagliptin n=7), *** = p")

among the three groups at 7d, 14d, and 28d, including the standard control group, the
contusion group, and the BMSC-Exos group (contusion + BMSC-Exos injection). Green
signal represents α-SMA, and blue signals show the nucleus. 100× magnification.")

. a Calcium deposition in cultured VSMCs was detected by alizarin red S staining. Scale bar = 80 mm. b Calcified nodules in cultured VSMCs was detected by alizarin red S staining. Scale bar = 100 µm. c Osteocalcin, Runx2, and α-SMA protein levels were analyzed by Western blot and quantified by densitometry. Statistical significance was assessed using t-test. All graphs show mean + SD. d Calcium content was measured as described in methods. e ALP activity was assessed by spectrophotometry. f Osteocalcin mRNA expression was determined by qRT-PCR. g Runx2 mRNA expression was determined by qRT-PCR. Statistical significance was assessed using t-test or ANOVA. All graphs show mean + SD. *P < 0.05, **P < 0.01, ***P < 0.001 vs. Control. ##P < 0.01, ###P < 0.001 vs. β-GP for 3 days")
 Protein expression levels of TGF‑β1,CTGF, fibronectin and α‑SMA in atrial tissues of heart were assessed via western blotting. The results are presented as the mean ± standard deviation (n=6). ###P<0.001 vs. sham group; **P<0.01 and ***P<0.001 vs. AF + LV‑NC group. CTGF, connective tissue growth factor; α‑SMA, α‑smooth muscle actin; AF, atrial fibrillation; LV‑NC, lentivirus negative control; miR, microRNA.")
 Western blot analysis for α-smooth muscle actin (α-SMA), collagen I, transforming growth factor (TGF)-β1 and connective tissue growth factor (CTGF). The relative expression of (B) α-SMA, (C) collagen I, (D) TGF-β1 and (E) CTGF. Data were shown as mean value ± SD (n=6). ***P<0.001, versus Control group. &&P<0.01, &&&P<0.001, versus NC agomir group.")
 H&E (2× and 10×) and immunohistochemical
(10×) staining regarding CD31, α-SMA of the skin samples at 3 and 7 day post implantation. Black arrows indicate blood vessels. Red arrows
indicate α-SMA-positive cells. (B) Quantification of blood vessel density in tissue peri-implants at 3 and 7 day post implantation. (per 1000 μm ×
500 μm area) (C) Quantification of IOD of α-SMA-positive cells at 7 days post implantation. (D) Western blot of α-SMA. β-actin served as a
loading control for the western blots. (E) Relative protein expression levels of α-SMA. *P < 0.05 and **P < 0.01.")

VSMCs were infected with NC or HOXA5
overexpression lentivirus for 48 h and then
treated with 10 ng/ml PDGF-BB for 24 h.
Western blot results of PPARγ protein levels
in VSMCs. Infected VSMCs were pretreated
with GW9662 for 3 h before PDGF-BB treatment (B–H). B) Western blot analysis of the
levels of calponin, α-SMA, SM22α, vimentin,
PCNA and thrombospondin. C, D) Representative images of calponin and vimentin in
VSMCs through immunofluorescence staining. The nucleus was stained with DAPI. Scale
bar, 50 μm. E) MTT assay was performed to
determine cell proliferation. F, G) Representative images and quantification of migrated
cells using the wound healing assay. Scale
bar, 200 μm. H) The transcriptional activity
of PPARγ was analyzed by luciferase reporter
assay. &, p < 0.05.")
 Mice fed a HFD were assigned to exercise and control groups, and then intraperitoneally
injected with 0.5 mg/kg MOTS-c or saline daily for eight weeks. (A) The skeletal muscle concentrations of MOTS-c were detected by ELISA kits after normalizing to
total protein content. (B–F) Protein expression of PGC-1α and GLUT4 as well as phosphorylation levels of AMPK and ACC in mouse muscle (n = 6–8 in each group)
were evaluated by immunoblotting. Each bar represents mean ± SD. * P < 0.05, **P < 0.01, remarkably different from HFD mice. #P < 0.05, remarkably different
from HFD mice with exercise intervention + MOTS-c treatment.")
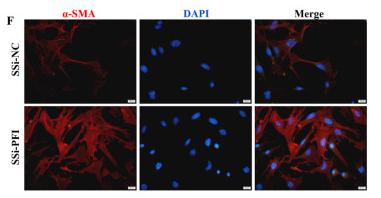
 Immunofluorescence was conducted to evaluate the expression of α-SMA (red). Nucleus was stained with DAPI (blue). Scale bar: 50 μm. (b) Relative mRNA expression of Col1a1 and α-SMA. (c, d) Expressions of p-MEK1/2, MEK1/2, p-ERK1/2, ERK1/2 were detected by western blot. GAPDH was conducted as a loading control. One-way ANOVA, **p < 0.01, ***p < 0.001, ****p < 0.0001")
 Immunofluorescence was conducted to evaluate the expression of α-SMA (red). Nucleus was stained with DAPI (blue). Scale bar: 50 μm. (b) Relative mRNA expression of Col1a1 and α-SMA. (c, d) Expressions of p-MEK1/2, MEK1/2, p-ERK1/2, ERK1/2 were detected by western blot. GAPDH was conducted as a loading control. One-way ANOVA, **p < 0.01, ***p < 0.001, ****p < 0.0001")

Immunohistochemistry staining of E-cadherin
and vimentin in lung tissues of mice. Scale bar
=50 μm. (b) The protein levels of E-cadherin,
fibronectin, α-SMA, and vimentin. Data were
expressed as mean ± SD. n = 6 in each group.
**p < 0.01 vs. control; ##p < 0.01 vs. BLM.")
, and LX-2 cells were cultured alone as negative control (NC). A. EdU assay to detect
the cell proliferation. EdU positive cells representing proliferation were stained in red with Azide 594. The nuclei of cells were stained in blue by Hoechst33342. B, C. The wound
healing and transwell assays to test the cell migration. After co-cultured with PM2.5-treated L-02 cells for 24h, LX-2 cells showed enhanced cell migration ability. D, E. qRT-PCR to
quantify the mRNA expression of a-SMA and COL-1 in LX-2 cells. b-actin was used as an internal control. F, G. The immunofluorescence staining to detect the protein expression
levels of a-SMA (green fluorescence) and COL-1(red fluorescence). *p < 0.05; **p < 0.01; ***p < 0.001. All data are expressed as the means ± SD from three independent experiments, each performed in triplicate. (For interpretation of the references to colour in this figure legend, the reader is referred to the Web version of this article.)")
 The effect of CR-WPI on the ratio of smooth muscle to collagen and protein expression of α-SMA (ratio to β-actin) in the corpus cavernosum. Bars denote the mean densitometry ratio between smooth muscle content and collagen content per field.")
 collagen I and (B) collagen III in atrial tissues of heart were determined via immunohistochemistry. At the same time, quantitative analysis was carried out. (C) Protein expression levels of TGF-β1, CTGF, fibronectin and α-SMA in atrial tissues of heart were assessed via western blotting. The results are presented as the mean ± standard deviation (n=6). ###P<0.001 vs. sham group; **P<0.01 and ***P<0.001 vs. AF + LV-NC group. CTGF, connective tissue growth factor; α-SMA, α-smooth muscle actin; AF, atrial fibrillation; LV-NC, lentivirus negative control; miR, microRNA.")
 Representative images of identification of CFs by immunofluorescence staining of α-SMA actin and Vimentin were used to identify the purity of myocardial fibroblasts isolated by double enzyme digestion. Nuclei were stained blue; α-SMA and Vimentin were stained red, magnification ×200. (c) Representative results of shape of CFs by fluorescence microscope in the control group and X-ray group (at 48h after irradiation). Magnification ×40. (d) RAS-RH inhibits proliferation rate of primary CFs after X-ray radiation depended on the manner of dose-time. CFs were treated with 3, 6, and 9 μg/ml of RAS-RH after X-ray irradiation for the indicated times. Proliferation rate of CFs was determined by CCK-8 assay (n = 5, ∗P < 0.05, ∗∗P < 0.01 vs. the control group, #P < 0.05, ##P < 0.01 vs. X-ray group). (e) TGF-β1-positive cells in each group with immunofluorescence staining. Nuclei were stained blue and TGF-β1 stained red, magnification ×200.")
 Representative images indicate the protein level of TGF-β1, COL1, and α-SMA were analyzed with western blotting by Image-J in the Con, X-ray, and RAS-RH + X-ray groups (n = 3, ∗P < 0.05, ∗∗P < 0.01 vs. the control group, #P < 0.05, ##P < 0.01 vs. X-ray group). (c) Quantitative real-time RT-PCR analysis of TGF-β1, COL1, and α-SMA mRNA levels in the Con, X-ray, and RAS-RH + X-ray groups (n = 3, ∗P < 0.05, ∗∗P < 0.01 vs. the control group, #P < 0.05, ##P < 0.01 vs. X-ray group).")
 TGF-β1 protein levels. (B) α-SMA protein levels. Data are presented as mean ± SEM (n > 3 for each group). #P < 0.05 vs. CON, ∗P < 0.05 vs. DKD.")
 by inhalation from day 21 to day 42. Mice were intraperitoneally injected with 20 mg/kg Rhy-SLNs or 20 mg/kg Rhy at one hour before the airway challenge with OVA. a, the representative images of Masson-stained airway in lung tissues. b and c, the representative images of periodic acid-Schiff-stained goblet cells of airway in lung tissues, which were quantified with the mucus score. Black arrows represented the goblet cells. d, the protein levels of α-SMA and collagen I. n = 6 in each group. *p < 0.05, **p < 0.01. OVA, ovalbumin; Rhy, rhynchophylline; Rhy-SLNs, rhynchophylline-solid lipid nanoparticles; α-SMA, alpha-smooth muscle actin")
. To fit into the manuscript properly, the gel was reasonably trimmed. aa, P < 0.01 vs the control group; b, P < 0.05, bb, P < 0.01 vs the Wnt-1 group. ##, P < 0.01 vs the normal group; *, P < 0.05 and **, P < 0.01 vs the model group")
 Representative immunohistochemical staining and (b) quantitative analysis of the expression of α-SMA, collagen-1, F4/80, p-H3, and Ki67 in XXD groups as indicated. n = 10 mice per group. All data are expressed as means ± SD. ▲P < 0.05, ▲▲P < 0.01 vs. the model group.")
 Representative western blots for MMP-9, α-SMA, ICAM-1, TGF-β1, Smad7, HIF1A, and GAPDH. Quantitative analysis of (b) MMP-9, α-SMA, ICAM-1, TGF-β1, Smad7, and HIF1A and normalized with GAPDH. (c) Representative protein bands of p-Smad3, Smad3, and β-actin in XXD-treated AKI mice. (d) Quantitative analysis of p-Smad3 and Smad3 and normalized with β-actin. All data are represented as the mean ± SD (n = 3). ▲P < 0.05, ▲▲P < 0.01 vs. the model group.")
 qRT-PCR was performed to compare the CSMD1 mRNA expression in fibroblasts transfected with Lenti-shRNA-CSMD1 (shCSMD1) and Lenti-GFP (shNC). All experiments were performed in triplicate and the data were shown as mean ± SD, *p < 0.05. (B) Immunofluorescence was performed to confirm the knockdown of CSMD1 protein expression in the CSMD1-silenced fibroblasts. Scale bar: 200 μm. (C) Histogram showing fluorescence intensity of CSMD1 in the shNC and shCSMD1 fibroblasts from the IF photos taken and analyzed using the NIS-Elements D software. (D-E) Transwell assays were performed to detect the migration of CSMD1-silenced fibroblasts. Quantification of numbers of migrated cells per field was presented as mean ± SD from three independent experiments in the right panel. Scale bar: 200 μm, **p < 0.01. (F-G) Wound healing assays were performed to detect the migration of CSMD1-silenced fibroblasts. The wound area at 0 h was set as 100%. Quantification of the healing rate was presented as mean ± SD from three independent experiments in the right panel. Scale bar: 200 μm, **p < 0.01. (H-I) qRT-PCR and western blot were performed to measure the ACTA2, COL1 and FN1 mRNA and protein levels respectively in the shNC and shCSMD1 fibroblasts. The results showed significantly upregulated mRNA levels of ACTA2, COL1 and FN1 upon CSMD1 knockdown, while only increased expression of FN1 at the protein level. *p < 0.05")
 Treatment schedule. (b) Body weight. (c) Photographs of tumors.
(d) Tumor growth curve. (e) Tumor inhibition rates. (f) H&E staining images. (g) Masson’s staining assay. (h) Immunohistochemistry assay of αSMA protein. (i) Microvessel density assay. Data are given as mean ± SD (n = 4). *P < 0.05, **P < 0.01, ***P < 0.001.")
 Serum levels of ALT and AST in Oil+vehicle, Oil+sTREM‐1, CCl4+vehicle and CCl4+sTREM‐1 groups. (B) Liver histology (HE staining, 100X). (C) Liver fibrosis (Sirius Red staining; 100X). (D) Collagen I and α‐SMA expressions (IHC staining, 200X). (E, F) Quantification of collagen I and α‐SMA protein expressions (Western blot). ns: not significant, * p < 0.05, ** p < 0.01, *** p < 0.001")
 Serum levels of ALT and AST in Oil+vehicle, Oil+sTREM‐1, CCl4+vehicle and CCl4+sTREM‐1 groups. (B) Liver histology (HE staining, 100X). (C) Liver fibrosis (Sirius Red staining; 100X). (D) Collagen I and α‐SMA expressions (IHC staining, 200X). (E, F) Quantification of collagen I and α‐SMA protein expressions (Western blot). ns: not significant, * p < 0.05, ** p < 0.01, *** p < 0.001")
 The distribution and expression of α‐SMA and the GFP carried by the AAV vector were detected in the liver tissue sections of CCl4+sTREM‐1+AAV‐shNC and CCl4+sTREM‐1+AAV‐shRobo2‐treated mice (200X). (B) Liver histology (HE staining, 200X). (C) Liver fibrosis (Sirius Red staining, 100X). (D, E) α‐SMA and collagen I expressions (IHC staining, 200X). (F, G) Western blot analysis showed the protein expressions of Robo2, α‐SMA, collagen I, p‐Smad2, p‐Smad3, Samd2/3, p‐PI3K, PI3K, p‐Akt and Akt in CCl4+sTREM‐1+AAV‐shNC and CCl4+sTREM‐1+AAV‐shRobo2 groups of primary HSCs. * p < 0.05, ** p < 0.01")
 Immunofluorescence staining of PPARγ and F4/80 in liver tissue; the nuclei were stained with DAPI (blue); magnification: ×200. (B) Immunofluorescence staining of PPARγ and α-SMA in liver tissue; the nuclei were stained with DAPI (blue); magnification: ×200. (C) Immunofluorescence staining of F4/80 in liver tissue; the nuclei were stained with DAPI (blue); magnification: ×200. (D) Immunohistochemistry staining of CD68 in liver tissue, magnification: ×200. Sch B, Schisandrin B; PPARγ, peroxisome proliferator-activated receptor gamma; DAPI, 4',6-diamidino-2-phenylindole.")
 Effect of TGF-β1 on cell proliferation was measured by MTT. (B-D) The protein expression of COL I and α-SMA was analyzed by western blot assay. Data from the three independent trials were represented by mean ± S.D. ∗∗∗p <0.001 TGF-β1 vs control; ∗∗p <0.01 TGF-β1 vs control; ∗p <0.05 TGF-β1 vs control.")
 were orally administered into the mice. (A) Macroscopic examinations of mouse livers were collected, and liver sections were stained with H&E, Masson's trichrome staining and Sirius Red (Scale bar: 50 μm). Data for Masson's trichrome staining and Sirius red staining were presented as the mean ± SD of 3 independent experiments. *p < 0.05, **p < 0.01. N.S. not significant. (B) The liver/body weight ratio, the levels of HYP, (C) ALT and AST in mouse serum were caculated. Data were presented as the mean ± SD of 3 independent experiments. *p < 0.05, **p < 0.01. N.S. not significant. (D) Western blot analyses of α‐SMA, COL1α1 and fibronectin proteins were performed. (n = 3 in every group). Data were presented as the mean ± SD of 3 independent experiments. *p < 0.05, **p < 0.01. N.S. not significant")
 Images of tumor tissue stained with hematoxylin-eosin (HE), Ki67, and TUNEL. Quantitative analysis of the (B) Ki67 positive area and (C) TUNEL positive area. (D) Immunofluorescence (IF) images of CD31 and α-SMA in LLC tumor tissue. The quantitative analysis of the (E) CD31+ vessel area and (F) α-SMA+/ CD31+ vessel area. The green scale bar is 100 µm, the white and black scale bar is 200 µm, and the yellow scale bar is 1000 µm.")
 collagen-1, (b) fibronectin (Fn), and (c) α-SMA. (d) Statistical expressions of fibrosis biomarkers in the immunohistochemical assay (∗∗p < 0.01 vs. the Sham group; ##p < 0.01 vs. the DKD group, n = 6). (e) Detection of fibrosis biomarker protein expressions by western blot analysis. (f) Statistical expressions of fibrosis biomarkers in the western blot assay (∗p < 0.05, ∗∗p < 0.01 vs. the Sham group; ##p < 0.01 vs. the DKD group, n = 3). The statistical results were compared with the Sham operation group and other groups.")
 collagen-1, (b) fibronectin (Fn), and (c) α-SMA. (d) Statistical expressions of fibrosis biomarkers in the immunohistochemical assay (∗∗p < 0.01 vs. the Sham group; ##p < 0.01 vs. the DKD group, n = 6). (e) Detection of fibrosis biomarker protein expressions by western blot analysis. (f) Statistical expressions of fibrosis biomarkers in the western blot assay (∗p < 0.05, ∗∗p < 0.01 vs. the Sham group; ##p < 0.01 vs. the DKD group, n = 3). The statistical results were compared with the Sham operation group and other groups.")

Representative livers photographs from Control, Model, and
drug-treated groups; (B) Histopathological characteristics of the mouse (Magnification × 200); (C), (D) Representative immunoblots and relative protein levels of
α-SMA; (E), (G) Collagen fibers (Blue color) in mouse liver visualized by Masson’s trichrome staining and representative image in each group was presented
(Magnification × 100); (F), (H) α-SMA expression was evaluated by immunohistochemistry (Magnification × 400); Data are presented as mean ± SD (n = 3 for each
group). #P < 0.05 VS. Control. # #P < 0.01 VS. Control. *P < 0.05 VS. Model. **P < 0.01 VS. Model. (For interpretation of the references to color in this figure
legend, the reader is referred to the Web version of this article.)")
 after incubation with different formulations at different concentrations for 48 h. c Migration experiment after different formulations treatment for 24 h. Scale bar, 100 μm. d Cell migration percentage. e Western blot analysis of FAP and α-SMA expression levels and f quantification data. **P < 0.01, ***P < 0.001")
 (n = 4); E-G: Col 1 and α-smooth muscle actin. Data are presented as mean ± SD. aP < 0.05, bP < 0.01, cP < 0.001, dP < 0.0001. α-SMA: α-smooth muscle actin.")
 knockdown reduced myocardial fibrosis 4 weeks after myocardial infarction (MI). (A) Representative images of myocardial tissues with Masson staining (magnification ×200, scale bar=100 µm). Blue staining indicates the collagen. (B) Western blot analysis of collagen I, collagen III, and α-SMA in myocardial tissues. β-actin served as the loading control.")
, vimentin (B), α-SMA (C) and Collagen I (F)
were determined by RT-qPCR. (D) The protein expression level of E-cadherin analyzed by Western blot. (E) The protein expression of E-cadherin relative to GADPH
protein expression. (G) The protein expression levels of vimentin and α-SMA analyzed by Western blot. The protein expression of vimentin (H) and α-SMA (I) relative
to GADPH protein expression. Data are expressed as the mean ± S.E.M. (n = 3–7), *P < 0.05 vs Sham; **P < 0.01 vs Sham; ***P < 0.001 vs Sham; ##P < 0.01 vs 5/6
Nx; ###P < 0.001 vs 5/6 Nx; ns, no significance.")
 BA reduced the expression of α-SMA in LTD4-induced type II AEC cells (200-fold) and (b) BA reduced the fluorescence intensity of α-SMA in LTD4-induced type II AEC cells. LTD4: 150 nM LTD4-induced type II AEC cells and BA: baicalin. Compared with the control group, ▲P < 0.05 and ▲▲P < 0.01; compared with the LTD4 group, #P < 0.05 and ##P < 0.01. Data are expressed as the mean ± SD (n = 3) and were analyzed by one-way ANOVA followed by Tukey analysis.")
 Expression levels of WTAP in low-fibrosis and high-fibrosis samples derived from the GEO database. (B) Small interfering RNA of WTAP was screened by RT-qPCR assay. (C) Optimal stimulation time of WTAP small interfering RNA was screened by RT-qPCR assay. (D) Optimal stimulation concentration of WTAP small interference RNA was screened by RT-qPCR assay. (E) Cell proliferation was detected by CCK8 assay. (F) The phase of the cell cycle was detected by flow cytometry. a, control group. b, model group. c, si-WTAP group. d, si-NC group. (G) Quantification of the cell cycle results. (H) mRNA expression level of α-SMA. (I) The mRNA expression level of collagen Ⅰ. (J) Protein expression levels of α-SMA. (K) Protein expression levels of collagen Ⅰ. (L) Semiquantitative analysis of α-SMA protein. (M) Semiquantitative analysis of collagen Ⅰ protein.")
 Positive staining of vimentin and negative staining of α-SMA in cultured fibroblasts by immunofluorescence (magnification, ×200). Scale bar = 200 μm. (B) Wound–scratch assay in fibroblasts treated with different media at 0 h, 24 h, 48 h (magnification, ×40). Scale bar = 400μm. (C) The percentage of migration area in different groups. (D) Cell number displayed as OD value of fibroblasts treated with different media in the CCK-8 assay. Data are shown as means ± standard deviation (SD). *P < 0.05; **P < 0.01; ***P < 0.001. BMSC-CM, bone marrow stem cell-conditioned medium; con, control medium treatment group; CM, BMSC-CM treatment group.")
 Western blot assessment of EMT-linked proteins in Patu-8988, as well as PANC-1 cells inoculated with 0, 50 and 100μM fisetin for 24 h. (B) Histogram illustrating E-cadherin protein contents. (C) Histogram illustrating N-cadherin protein contents. (D) Histogram illustrating Vimentin protein contents. (E) Histogram illustrating alpha-SMA protein contents. (F) Histogram illustrating Collagen I protein contents. (G) Histogram illustrating Collagen III protein contents. All assays were replicated thrice, and data are given as means±SD.*p<.05, **p<0.01, ***p<.001, ****p<.0001, in contrast with the controls.")
 on cisplatin-induced renal injury and fibrosis in vivo. (A) The schematic diagram of mice infected with cisplatin solution intraperitoneally and suspension of BM-MSCs via the tail vein. (B) Image of the morphology of kidney in mice infected cisplatin solution intraperitoneally and suspension of BM-MSCs via the tail vein. (C) H&E, Masson, and Sirius red staining. (D, E) serum creatinine (SCr) and blood urea nitrogen (BUN) levels of serum in mice were determined. The relative mRNA expression levels (F, G) and the protein levels (H) of α-SMA and Col1α1 in mice kidney tissues were evaluated by real-time PCR and Western blot, respectively. Data represent the mean ± SE from three independent experiments. *P < 0.05; **P < 0.01; ***P < 0.001; NS, not significant.")
 and Velocyto R package (lower). H CEBPD_extended motif showed greater enrichment of regulon activity for PLA2G2Ahigh fibroblasts using SCENIC analysis (left panel). MEF2C_extended motif showed greater enrichment of regulon activity for ACTA2high fibroblasts (left panel). t-SNE visualization of AUC values of CEBPD_extended and MEF2C_extended motifs in fibroblasts (right panel). I Schematic developmental trajectories of fibroblast subpopulations in FHP lungs. *P < 0.05, **P < 0.01, ***P < 0.001, ****P < 0.0001.")
 demonstrated IκB phosphorylation and NF-κB nuclear transfer (n = 3). (d) Renal pathology of clinical lupus patients with FXR (red) and α-SMA (green) double staining (scale bar, 100 μm).")

 and antibodies to α‑SMA, Collagen I and Fibronectin (red), immunofluorescence staining (magnification × 200), Scale bars = 40 μm. **P < 0.01 vs control group; ***P < 0.001 vs control group; #P < 0.05 vs TGF-β1 group; ##P < 0.01 vs TGF-β1 group")

, Col1a1 (F), and Col3a1 (G) in the penumbra of the ischemic heart measured with real-time PCR. Data are expressed as the mean ± SD (n=6/group). **P<0.01.")

 The representative band of Western blot. (b)–(h) The quantitative result of Western blot. Data were expressed as mean ± SD. #P < 0.05/##p < 0.01 vs. control; ∗p < 0.05/∗∗p < 0.01 vs. the BLM group. n = 3.")
 mHSCs were co-cultured with the CMs from RAW264.7 cells with LPS/IFNγ and PHI treatment for 12 h. (b-g) The expression of MMP2, TIMP1, TGF-β, α-SMA, COL1 and NF-κB mRNA in mHSCs after co-culture with macrophage-derived CMs for 24 h was detected by RT-qPCR (n = 3). (h) The expression of TGF-β, α-SMA, COL1, P65 and P-P65 proteins in mHSCs after co-culture with macrophage-derived CMs for 24 h was detected by western blotting. (i) The relative quantification of TGF-β, α-SMA, COL1 and P-P65/P65 protein expression in western blotting results was analyzed by ImageJ software (n = 3). (j) The expression of cytoplasm and nucleus NF-κB P65 proteins in mHSCs after co-culture with macrophage-derived CMs for 24 h was detected by western blotting. (k, l) The relative quantification of cytoplasm and nucleus NF-κB P65 protein expression in western blotting results was analyzed by ImageJ software (n = 3). (m) Immunofluorescence staining of α-SMA in mHSCs after co-culture with CMs from RAW264.7 cells with different treatments for 24 h (Scale bar=100 µm). Results are presented as mean ± SD. ###P")
 mHSCs were co-cultured with the CMs from RAW264.7 cells with LPS/IFNγ and PHI treatment for 12 h. (b-g) The expression of MMP2, TIMP1, TGF-β, α-SMA, COL1 and NF-κB mRNA in mHSCs after co-culture with macrophage-derived CMs for 24 h was detected by RT-qPCR (n = 3). (h) The expression of TGF-β, α-SMA, COL1, P65 and P-P65 proteins in mHSCs after co-culture with macrophage-derived CMs for 24 h was detected by western blotting. (i) The relative quantification of TGF-β, α-SMA, COL1 and P-P65/P65 protein expression in western blotting results was analyzed by ImageJ software (n = 3). (j) The expression of cytoplasm and nucleus NF-κB P65 proteins in mHSCs after co-culture with macrophage-derived CMs for 24 h was detected by western blotting. (k, l) The relative quantification of cytoplasm and nucleus NF-κB P65 protein expression in western blotting results was analyzed by ImageJ software (n = 3). (m) Immunofluorescence staining of α-SMA in mHSCs after co-culture with CMs from RAW264.7 cells with different treatments for 24 h (Scale bar=100 µm). Results are presented as mean ± SD. ###P")
. b H&E staining of pulmonary arteries in lung tissues in normoxia and hypoxia group (N = 8). Scale bars, 50 μm. c Quantification of ratio of pulmonary arterial medial thickness to total vessel size (media/CSA) (N = 8). Relative mRNA level (d) and protein level (e, f) of HSP110 in pulmonary arteries (N = 8). g Double immunofluorescence staining of YAP (green) and HSP110 (red) in pulmonary arteries (N = 8). Scale bars, 50 μm. White arrows pointed to HSP110 and YAP double-positive cells. h Double immunofluorescence staining of α-SMA (green) and HSP110 (red) in pulmonary arteries (N = 8). Scale bars, 50 μm. White arrows pointed to HSP110 and α-SMA double-positive cells. Data are means ± SD from 8 mice per group. *p")


 The expression levels of collagen Ⅰ, fibronectin and α-SMA in the lung tissues of mice were detected by Western blotting. (E,F) Immunohistochemical staining analysis of collagen I, fibronectin, α-SMA and Ki-67, 20x, Scale bar = 50 μm. Data are shown as the mean ± SD. # represents the difference between the NaCl and model groups, # p < 0.05, ## p < 0.01, ### p < 0.001. * represents the difference between the model and treatment groups,")
 The expression levels of collagen Ⅰ, fibronectin and α-SMA in the lung tissues of mice were detected by Western blotting. (E,F) Immunohistochemical staining analysis of collagen I, fibronectin, α-SMA and Ki-67, 20x, Scale bar = 50 μm. Data are shown as the mean ± SD. # represents the difference between the NaCl and model groups, # p < 0.05, ## p < 0.01, ### p < 0.001. * represents the difference between the model and treatment groups,")

 The cell invasion ability of transfected VSCMs from different groups was evaluated using crystal violet staining. (B) Cell invasion ability was compared among different groups. (C) Protein expression levels of α-SMA and OPN were compared among different groups. The levels of (D) α-SMA and (E) OPN in transfected VSMCs in different groups are shown. *P")
 gray value of these proteins (B). After LX-2 cells were stimulated with PDGF-BB (10 ng/mL) and different concentrations of gomisin D were added, α-SMA and collagen I of LX-2 cells treated with gomitin D at different concentrations were analyzed by QRT-PCR (C) and the survival of HSCs was detected by CCK-8 assay (D). Data are presented as mean ± SD, n = 3. ⁎p < 0.05 versus PDGF-BB(−)/gomisin D(−) group; #p < 0.05 versus PDGF-BB(+)/gomisin D(−) group.")
A1 was expressed in liver tissue. Anxa1 was stained brown. Compared with the control group, the liver tissue in mice treated with CCl4 showed obvious AnxA1 staining. More liver tissue was stained at 8 wk than at 4 wk. The AnxA1-/- model groups were hardly stained. More tissue staining was observed in the CCl4-induced model group after Ac2-26 treatment, while staining was almost absent after Boc2 intervention; C: AnxA1 mRNA expression; D: Protein expression of AnxA1, α-smooth muscle actin, β-catenin, and GAPDH (n = 8). Results are presented as ratios of target mRNA or protein normalized to internal GAPDH. aP < 0.05 vs control; bP < 0.01 vs CCl4; cP < 0.05 vs CCl4 + Ac2-26; dP < 0.05 vs intra-group. Ac2-26: Active N-terminal peptide of annexin A1; AnxA1: Annexin A1; Boc2: N-formyl peptide receptor antagonist N-Boc-Phe-Leu-Phe-Leu-Phe; α-SMA: α-smooth muscle actin.")
 Representative micrographs of hematoxylin and eosin (H&E) staining, Masson staining, and Sirius red staining of the lung tissue sections from the indicated groups of mice. Scale bars, 100 µm. (B) Hydroxyproline content of the lung in indicated mouse groups (n = 6 mice per group). (C-E) Western blotting assay and quantification of the α-SMA and collagen-I proteins in lung tissues from indicated groups. (F-G) qRT-PCR analysis of mRNA expression of the α-SMA and collagen-I in lung tissues from indicated groups.")
 Treatment schedule. (B) Tumor images. (C) Tumor volumes. (D) Tumor growth inhibition rates. (E) H&E and (F) Masson staining assays. Immunohistochemical assays of (G) α-SMA and (H) CD31 proteins, with red arrows indicating the tumor vessels (scale bars, 50 µm). *P")
 Representative H&E, EVG and a-SMA staining (×100) of pulmonary arterioles. (B-D) Yap deficiency intensifies hypoxia-induced pulmonary vascular remodeling and is attenuated by lentivirus-mediated VEGF165 transfection, which is evidenced by percentage of wall thickness (B), percentage of medial wall area (C), and semiquantitative determination of relative gray value of a-SMA (D). n=6 animals/group, Scale bar =50 μm. H&E=hematoxylin and eosin, EVG=elastic Van Gieson, α-SMA=anti-α-smooth muscle actin.")

 Schematic diagram of UUO and adenovirus infection experiments in mice. (B) Western blotting analyses of protein expression levels of α-SMA, fibronectin, and collagen type I at days 3, 7, and 14. (C) Immunohistochemistry was conducted with anti-FOSL2 antibody to demonstrate FOSL2 protein expression in renal tissues. Magnification: 400×. Scale bar: 50 μm. (D) The mRNA and protein expression levels of FOSL2 were analyzed using qRT-PCR and western blotting, respectively. The values are expressed as mean ± standard deviation. *P < 0.05 versus sham (Day 3) group; ##P < 0.01 versus sham (Day 7) group, ++P < 0.01 versus sham (Day 14) group. UUO: unilateral ureteral obstruction; α-SMA: α-smooth muscle actin; qRT-PCR: quantitative real-time polymerase chain reaction; FOSL2: fos-related antigen 2.")
 Immunofluorescence staining showed that BV-LPS could abolish EC-LPS-induced EMT in A549 cells (magnification, ×600). (C) Reverse transcription-quantitative PCR assay showed that BV-LPS could abolish EC-LPS-induced inflammation in A549 cells. (D and E) Western blot analysis showed that BV-LPS could abolish EC-LPS-induced EMT in A549 cells. **P")
 Immunofluorescence staining showed that BV-LPS could abolish EC-LPS-induced EMT in A549 cells (magnification, ×600). (C) Reverse transcription-quantitative PCR assay showed that BV-LPS could abolish EC-LPS-induced inflammation in A549 cells. (D and E) Western blot analysis showed that BV-LPS could abolish EC-LPS-induced EMT in A549 cells. **P")
 SPINT2 expression was co-stained with α-SMA expression in human TAD specimens. (B) The mRNA levels of SPINT2 in aorta tissues of patients with TAD were determined using reverse transcription-quantitative PCR. (C) SPINT2 protein levels of aorta tissues were analyzed by western blotting. ***P")
 The expression levels of the synthetic proteins (vimentin and collagen I) were detected by western blotting. (B) The expression levels of the contractile proteins (α-SMA and SM22α) were detected by western blotting. (C) The expression levels of vimentin were assessed by immunofluorescence analysis. The nuclei were stained with DAPI. Scale bar, 100 µm. ***P")
 oil red O staining and quantitative analysis of aortic sections from MiR-22-3p agomir or negative control (NC) mice; (b) Masson’s staining and quantitative analysis of aortic sections from MiR-22-3p agomir or NC mice (original magnification, × 40; bar = 500 μm); (c) sirius red staining and quantitative analysis of aortic sections from MiR-22-3p agomir or NC mice (original magnification, × 40; bar = 500 μm); (d) macrophage antigen-3 (Mac-3) immunostaining and quantitative analysis of aortic sections from MiR-22-3p agomir or NC mice (original magnification, × 40; bar = 200 μm); and (e) quantitative analysis of smooth muscle cells by α-smooth muscle actin immunostaining of aortic sections from MiR-22-3p agomir or NC mice (original magnification, × 40; bar = 500 μm). (*P")

")
 bright field examination, α-SMA expression, and Phalloidin staining. Scale bar: 200 and 100 μm. (b, n = 6) VSMC viability was evaluated in different doses of HLJDD using the cell counting kit-8. The effect of HLJDD on foam cell formation was tested in (c) ORO, (d) Nile Red, (e) Annexin V/PI staining, and (f) ROS generation. n = 3, 3, 5, and 5, respectively. (g) Phalloidin and Giemsa staining on VSMCs and A7r5 cell line, respectively. Scale bar: 100 μm. Foam cell formation was also evaluated via (h) Western blot for (i, n = 4) α-SMA, (j, n = 5) SM22-α, (k, n = 4) TNF-α, (l, n = 3) IL6, (m, n = 8) OPN, (n, n = 7) CD36, and (o, n = 5) Caspase 3. Data were presented as mean ± standard deviation in one-way ANOVA with Dunnett post hoc tests. ns: not significant")
 bright field examination, α-SMA expression, and Phalloidin staining. Scale bar: 200 and 100 μm. (b, n = 6) VSMC viability was evaluated in different doses of HLJDD using the cell counting kit-8. The effect of HLJDD on foam cell formation was tested in (c) ORO, (d) Nile Red, (e) Annexin V/PI staining, and (f) ROS generation. n = 3, 3, 5, and 5, respectively. (g) Phalloidin and Giemsa staining on VSMCs and A7r5 cell line, respectively. Scale bar: 100 μm. Foam cell formation was also evaluated via (h) Western blot for (i, n = 4) α-SMA, (j, n = 5) SM22-α, (k, n = 4) TNF-α, (l, n = 3) IL6, (m, n = 8) OPN, (n, n = 7) CD36, and (o, n = 5) Caspase 3. Data were presented as mean ± standard deviation in one-way ANOVA with Dunnett post hoc tests. ns: not significant")
 Mice were intratracheally instilled with bleomycin (2 U kg−1) or saline for 2 weeks, and Nile red (NR)-loaded Gal-TMPDA (5 mg mL−1, 200 µL) was instilled via tail veins and traced by IVIS system (Color Scale: Min = 1.94e8, Max = 2.41e9) at the major organs at the indicated time periods post nanoparticles injection (n = 3). B–I) The simplified experimental scheme. C57BL/6J mice were intratracheally instilled with bleomycin for 6 days, and then divided randomly into five groups for treatment with free DQ (D: 0.7 mg kg−1, Q: 2.6 mg kg−1), MPDA (5 mg mL−1, 200 µL), TMPDA (5 mg mL−1, 200 µL), Gal-MPDA@DQ (MPDA: 5 mg mL−1, D: 70 µg mL−1, Q: 260 µg mL−1, 200 µL) or Gal-TMPDA@DQ (TMPDA: 5 mg mL−1, D: 70 µg mL−1, Q: 260 µg mL−1, 200 µL). Mice were sacrificed 24 days after bleomycin injection, and blood, bronchoalveolar lavage fluid (BALF), and major organ sections were collected for analysis (B). The changes of body weights (n = 8) (C); final weight level (n = 8) (D); H&E staining of lung tissues, Scale bars, 1 mm and 100 µm (n = 3) (E); hydroxyproline content in lung tissues (n = 5) (F); Masson staining of lung tissues. Scale bar, 100 µm (n = 3) (G), and quantification of Masson staining of collagens (n = 3) (H). Immunofluorescence staining of α-SMA in lung tissues. Nuclei, DAPI. Scale bar = 50 µm (n = 3) (I), and quantification of α-SMA levels in lung tissue sections (n = 3) (J). Data are presented as means ± SD.")
 The expression level of let-7 g in PAECs ;(B) Immunofluorescence double staining of CD31 and α-SMA in RPAECs treated with let-7 g mimic; (C) Immunofluorescence double staining of CD31 and α-SMA in RPAECs treated with let-7 g inhibitor; (D) the potential binding sites of let-7 g to TGFβR1 predicted by Targetscan 7.0 and quantification of the fluorescence intensity in HEK293T cells; (E-F) After transfection of let-7 g mimic or inhibitor, the expression level of TGFβR1 protein in HPAECs; (G) Transfection of after transfection of TGFβR1-Si, the expression levels of CD31, Vimentin and α-SMA were detected by Western blot")
 Endoscopic view after ESD and PHEGFs culture at different stages. (B) The primary cells were identified as fibroblasts by immunocytochemistry. (C) Flow cytometry detection of PHEGFs apoptosis rate after β-elemene intervention (n = 3). (D) CCK-8 to assess the proliferation of PHEGFs after β-elemene intervention (n = 3). (E) Flod change of FAP, p-PTEN, p-PI3K, and p-AKT (n = 3).*P < 0.05 versus the control group.")
 Protein levels of Smad2/3, p-Smad2/3, Smad4, Vimentin, α-SMA, and E-cadherin in type II AECs co-cultured with Tregs supernatant were detected by Western blot. *P<0.05, **P<0.01, ***P<0.001, n = 3.")
 (A), and the fibrotic region areas were quantified (B), n = 6. C, D Representative immunostaining (scale bar, 10 μm) (C) and immunofluorescence (scale bar, 20 μm) (D) for α-SMA in fibrotic regions of the heart 38 days after the sham/MI operation. C Blue: hematoxylin; brown: a-SMA. D Red: a-SMA; blue: DAPI. E, F Representative images showing collagen I (E) and III (F) immunofluorescence staining. Scale bar, 20 μm. G–J Ejection fraction (EF) (G), left ventricular fractional shortening (LVFS) (H) end-diastolic volume (EDV) (I) and end systolic volume (ESV) (J) as quantified via echocardiography 38 days after the sham/MI operation; n = 9, 9, 19, and19, respectively. K–O On the 38th day after MI surgery, F4/80+ macrophages were isolated from the fibrotic area of MI-PBS, MI-NaW, sham, and sham-NaW mice, and the expression of Tgfb1, Arg1, Mrc1, Tnf, and Nos2 in macrophages was measured by real-time PCR; n = 7, 7, 8, and 8, respectively. P–R The expression of Gys1, Ugp2, Slc2a1, and Pygl in the M2 macrophages isolated from the hearts of two groups of mice was measured by real-time PCR. n = 8, 8, 8, and 8, respectively. Unless otherwise specified, n = 3 biologically independent experiments. The data are presented as the mean ± SEM. P values were calculated by one-way ANOVA. *P")
 Representative western blotting bands of p-c-Fos, p-c-Jun, LOX, CCND1, COL Ⅰ, COL Ⅲ, and α-SMA in the myocardium, with vinculin, and GAPDH as internal reference. (B–K) Statistical graphs of p-c-Fos, p-c-Jun, LOX, CCND1, COL Ⅰ, COL Ⅲ, and α-SMA (n = 3). Data are presented as mean ± SEM. nsP > 0.05; ▲▲P < 0.01 vs the sham; *P < 0.05, **P < 0.01 vs the model; ##P < 0.01 vs the ONSMP-L; ※P < 0.05, ※※P < 0.01 vs the ONSMP-M.")
 Cross-analysis of metabolic pathways in different high-expression cells in the PVTT (Venn diagram). (B) Cell2location show the spatial co-expression of metabolism of the key polyamine enzyme ODC1 with Fibroblast and hepatocyte cells in spatial samples. (C) mIHC validation of α-SMA/ODC1 co-expression in normal, tumour, and PVTT samples. (D) Differential analysis of α-SMA+/ODC1+ cells in normal, tumour, and PVTT samples. (E) Co-expression analysis of ODC1 and CD8T cells in normal, tumour, and PVTT samples. (F) Differential expression analysis of ODC1+ cells in normal, tumour, and PVTT samples. (G) Correlation analysis of ODC1 and CD8A in normal, tumour, and PVTT samples.")
Sirius red-stained liver sections. Observed at 100x and 200x, respectively. Scale bar = 100 μm.(C-D)Representative images of α-SMA and Collagen I protein expression in liver tissues were obtained using IHC(50 μm).(E-F)The results show the mean IOD of α-SMA and Collagen I proteins stained by IHC. Data are shown as means ± SD. Compared with CON group, **P < 0. 01. Compared with ANIT group, ##P < 0. 01. n = 10.")
 Expression of changes in fibrosis-related indexes, including α-SMA, FN, COL1, and BTK, as well as NF-κB and their phosphorylation-related proteins, were analyzed by western blotting; (b、c、d、e、f) Statistical values are expressed as mean ±SD. *:p<0.05; **:p<0.01.")
. (A) Summary of animal experiment process; (B) the morphological characteristics of mice kidneys exhibit variations among different groups; (C) the ratio of kidney weight to body weight was measured; (D) comparison for SCr levels of mice in each group; (E) representative micrographs of kidney tissues from different groups were obtained through HE & Masson staining; (F–G) comparison for BUN and β2-MG levels of mice in each group; (H–K) western blotting was performed to detect the levels of α-SMA, TGF-β and p-Smad expression; (L) tubular injury score; (M) collagen volume fraction. The data for figure (C,D, F,G) was expressed as the means ± SD (n = 12); The data for figure (H–M) was expressed as the means ± SD (n = 3); ##p")
 Workflow of the animal experiment. (B) Lung histology with H&E staining (arrows indicate: black—narrowed alveoli; yellow—lymphocyte/neutrophil infiltration; red—inflammatory cells surrounding blood vessels; blue—bronchial cell degeneration). (C) Masson’s trichrome staining of lung tissue. (D) Quantitative analysis of lung fibrosis (lower panel, scale bar = 200 μm, enlarged from upper panel, scale bar = 2 mm). (E) Western blot for protein expressions of E-cadherin, N-cadherin, α-SMA, and Collagen I in lung tissue. (F–I) Quantitative protein expression analysis using ImageJ software (n = 5). *p < 0.05, **p < 0.005, ***p < 0.001, compared to the BLM group. # p < 0.05, ## p < 0.005, ### p < 0.001, compared to the Sham group.")
. Kidney tissues in different groups were obtained and histopathology was monitored by Masson staining. Arrowheads indicated the collagen deposition and fibrotic lesions. B Quantization diagram of panel A as shown in the right. C Western Blot was used to detect the expression of α-SMA, collagen I and collagen III in the above kidney tissues (n = 3/group). D Quantization diagram of panel C as shown in the right. The histogram is presented by Means ± SD. *P")
 The degree of fibrosis in kidney tissue measured by Masson staining (Magnification, ×400). (B, D) The degree of fibrosis in kidney tissue measured by Sirius red staining (Magnification, ×400). (E, F) Immunohistochemical detection of α-SMA expression in kidney tissue (Magnification, ×400). (G, H) Western blot detection of α-SMA expression in the kidney tissue. Glyceraldehyde 3-phosphate dehydrogenase (GAPDH) is used as an internal control. Data are expressed as the mean ± SD; n = 3, **P < 0.01 versus the control group; ##P < 0.01 versus the model group.")
 The degree of fibrosis in kidney tissue measured by Masson staining (Magnification, ×400). (B, D) The degree of fibrosis in kidney tissue measured by Sirius red staining (Magnification, ×400). (E, F) Immunohistochemical detection of α-SMA expression in kidney tissue (Magnification, ×400). (G, H) Western blot detection of α-SMA expression in the kidney tissue. Glyceraldehyde 3-phosphate dehydrogenase (GAPDH) is used as an internal control. Data are expressed as the mean ± SD; n = 3, **P < 0.01 versus the control group; ##P < 0.01 versus the model group.")
, NIH/3T3 cell scratch assay (b) and representative fluorescence images of cell crawl (c), relative fluorescence quantification of Col1 (d) and α-SMA (e) (n = 4; ****: p < 0.0001; ***: p < 0.001; **: p < 0.01; and *: p < 0.05).")
 Immunofluorescence analysis of p-P38MAPK expression in DCM mice (X400). (B) Immunofluorescence analysis of TNF-α expression in DCM mice (X400). (C) Immunofluorescence analysis α-SMA expression in DCM mice (X400). (D) Immunofluorescence analysis of Collagen-I expression in DCM mice (X400). (E-H) Quantitative analysis of immunofluorescence of p-P38MAPK, TNF-α, α-SMA, and Collagen-I expression in myocardial tissue. Data are presented as means±SD, from 3 independent experiments. (*P < 0.05, **P < 0.01 compared with the control group; #P < 0.05, ##P < 0.01 compared with the DCM group, n = 3).")
 Anti-human mitochondrial staining showed the survival of transplanted cells for 1 and 4 weeks in vivo. (C–F) Blood vessel density determined by a-SMA and VWF staining for 4 weeks in vivo. ***P < 0.001, #P < 0.05, ##P < 0.01, ###P < 0.001.")
 into Adenine-induced model mice through the tail vein twice weekly for 8 weeks. B Mice were injected with DiR-labeled exosomes from NRK-52E cells via the tail vein. Fluorescent images of organs were acquired using an IVIS Spectrum Small Animal Optical Imaging System. Fluorescence luminescence of the heart, lungs, liver, spleen, and kidneys was assessed 12 h after injection. C, D Representative western blots (C) and quantitative data (D) of CD63, Hsp70, and TSG101 in the kidneys of model mice after injecting Ctrl-Exo or UA-Exo (n = 6). *p")
 The fluorescence intensity of SMA-α and SM22α detected by IF. (b) The mRNA expression of SMA-α and SM22α measured by RT-qPCR. *P < 0.05 compared to ANV.")
 for 12 h to induce cell polarization. In some experiments, Ruxolitinib was applied to the cells at 5 and 10 μM. (A) Schematic diagram of the co-culture system. (B) Scratch assay of cells co-cultured with IL-4/13 (20 ng/mL) and Ruxolitinib (5 and 10 μM). Scratch closure was imaged at 0, 12, 24, and 48 h. (C) qPCR analysis of mRNA expression levels of Acta-2, Col-1, and Fn. (D) Western blot analysis of α-SMA, COL-1, and FN protein expression levels. Data are presented as mean ± SEM (n = 3). *P < 0.05, **P < 0.01, ***P < 0.001.")
 Protein expression levels of α-SMA and FN in lung tissues. (B) Immunohistochemical staining of α-SMA and COL-1 in lung tissues. Scale bar = 50 μM. (C) mRNA expression of Acta-2, Col-1, and Fn in lung tissues. (D) Co-localization immunofluorescence staining of F4/80, CD206, and COL-1 in lung tissues. Scale bar = 50 μM. Data are presented as mean ± SEM (n = 5–6). Comparisons between groups were analyzed by one-way ANOVA. *P < 0.05, **P < 0.01, ***P < 0.001.")
 and DAPI staining of nuclei (blue). Scale bar, 50 μm, n = 6. B The expression level of α-SMA in pulmonary vessels was analyzed by immunofluorescence. α-SMA (green) and DAPI staining of nuclei (blue). Scale bar, 50 μm, n = 6. C + D Statistical analysis of Tunel positive cells and the average fluorescence intensity of α-SMA. E Correlation analysis between caspase-8 activity and Tunel positive cells in lung tissue. F Correlation analysis between NLRP3 positive area and Tunel positive cells in lung tissue. The p value was analyzed by one-way ANOVA with multiple comparisons, followed by Tukey's post hoc test. *p < 0.05, **p < 0.01, ***p < 0.001. (For interpretation of the references to colour in this figure legend, the reader is referred to the web version of this article.)")
 post-myocardial infarction (MI) contributes to atrial fibrosis and enlargement, and this is alleviated by HDAC6 deficiency. (A) Illustration of the experimental protocol. (B, C) HDAC6 protein, mRNA levels, and immunofluorescence (scale bar: 100 μm) were evaluated in the sham group and at 3 and 14 days post-MI. (D, F) Masson's staining of the LA at 14 days post-MI, along with the western blot of fibrosis-related proteins (α-SMA and collagen I). The results of the quantitative analysis of the fibrosis area and protein levels are shown. (E) Representative echocardiography, gross specimens, and wheat germ agglutinin (WGA) staining (scale bar: 50 μm) of the LA at 14 days post-MI, performed to evaluate LA enlargement and cardiomyocyte size. The LA diameter, LA area, LA weight/TL (tibia length), LA area/TL, and the frequency distribution of cell size were evaluated separately. *p")
 Masson's staining for observation of fibrosis in renal tissue. (C-D) Immunohistochemical observation of protein expression of fibrosis markers(Fibronectin, E-Cadherin, Collagen I, and α-SMA). (E-F) Western blot detection of protein expression of fibrosis markers in renal tissue species. (A-F) Data were shown as mean ± SD, n = 3. ##p < 0.01, *p < 0.05, ⁎⁎p < 0.01, ns, no significant difference.")
 Multi-color IHC staining exhibited the existence of each CAFs subtypes. CD10(MME) for myCAF_12, KALF4 for iCAF_17, and TIAM1 for iCAF_19 (C) The spatial arrangement of major cell types and the dynamic change before and after chemotherapy. The grey dashed lines showed the boundary of tumor.")
 and three key targets (THBS2, MAFI2, and FGF9) were detected using western blotting. Each experiment was performed at least three times; *P < 0.05, **P < 0.01, ***P < 0.001.")
 The status of rat renal tissue was assessed using hematoxylin and eosin staining (bar = 20 μm). (b) BUN and Crea levels were tested by an automated biochemical analyzer (n = 5). (c) α-SMA and fibronectin levels were detected by immunohistochemistry (n = 3). op")
 The thickness of LF was measured by MRI before operation. The thickness of LF at the L4/5 facet joint level was indicated by red arrow. (B) Representative tissues of LF acquired from patients with spinal surgery. The top three were from non-LFH patients and the bottom three were from LFH patients. Scale bar = 5 mm. (C) Representative images of H&E, MASSON, and EVG staining of the non-LFH group (n = 6) and the LFH group (n = 6). The yellow dotted area represents collagen fibers. Scale bar = 20 μm. (D) Immunohistochemical staining of THBS1, TGFβ1, COL1A2, and α-SMA in the LF samples from LFH group (n = 6) and non-LFH group (n = 6), and the percentage of positive cells was quantified. Scale bar = 20 μm. (E) TEM of LF ultrastructure of non-LFH and LFH groups. The yellow area represents elastin fibers. Scale bar = 8 μm. (F) The qRT-PCR analysis results showing that LFH group (n = 6) had a higher mRNA level of THBS1, TGFβ1, ACTA2 (α-SMA), and COL1A2 compared with non-LFH group (n = 6). The 2−ΔΔCt method was used to normalized with GAPDH. (G) Western blotting assay of THBS1, TGFβ1, COL1A2, and α-SMA protein levels of LF samples of the two groups. GAPDH served as the loading control. EVG: verhoeff's van gieson, TEM: transmission electron microscope, EF: elastic fiber, CF: collagen fiber. **p < 0.01, ***p < 0.001.")
 The thickness of LF was measured by MRI before operation. The thickness of LF at the L4/5 facet joint level was indicated by red arrow. (B) Representative tissues of LF acquired from patients with spinal surgery. The top three were from non-LFH patients and the bottom three were from LFH patients. Scale bar = 5 mm. (C) Representative images of H&E, MASSON, and EVG staining of the non-LFH group (n = 6) and the LFH group (n = 6). The yellow dotted area represents collagen fibers. Scale bar = 20 μm. (D) Immunohistochemical staining of THBS1, TGFβ1, COL1A2, and α-SMA in the LF samples from LFH group (n = 6) and non-LFH group (n = 6), and the percentage of positive cells was quantified. Scale bar = 20 μm. (E) TEM of LF ultrastructure of non-LFH and LFH groups. The yellow area represents elastin fibers. Scale bar = 8 μm. (F) The qRT-PCR analysis results showing that LFH group (n = 6) had a higher mRNA level of THBS1, TGFβ1, ACTA2 (α-SMA), and COL1A2 compared with non-LFH group (n = 6). The 2−ΔΔCt method was used to normalized with GAPDH. (G) Western blotting assay of THBS1, TGFβ1, COL1A2, and α-SMA protein levels of LF samples of the two groups. GAPDH served as the loading control. EVG: verhoeff's van gieson, TEM: transmission electron microscope, EF: elastic fiber, CF: collagen fiber.")
 The H&E staining in the human control cerebral artery and IA tissues (n = 4; 100 × and 300 ×; bar, 100 µm and 50 µm). (B) Immunohistochemical staining for α-SMA (n = 3; 300 ×; bar, 50 µm). (C) Immunohistochemical staining for SM22α (n = 3; 300 ×; bar, 50 µm). (D) The relative IOD/area of α-SMA and SM22α. (E) The bands of α-SMA and SM22α in the human control cerebral artery and IA tissues (n = 3; Western blot). (F) The relative expressions of α-SMA and SM22α. (G) The bands of MMP2 and MCP-1 in the human control cerebral artery and IA tissues (n = 3; Western blot). (H) The relative expressions of MMP2 and MCP-1. Data were expressed as mean ± SD, * P")
 The H&E staining in the human control cerebral artery and IA tissues (n = 4; 100 × and 300 ×; bar, 100 µm and 50 µm). (B) Immunohistochemical staining for α-SMA (n = 3; 300 ×; bar, 50 µm). (C) Immunohistochemical staining for SM22α (n = 3; 300 ×; bar, 50 µm). (D) The relative IOD/area of α-SMA and SM22α. (E) The bands of α-SMA and SM22α in the human control cerebral artery and IA tissues (n = 3; Western blot). (F) The relative expressions of α-SMA and SM22α. (G) The bands of MMP2 and MCP-1 in the human control cerebral artery and IA tissues (n = 3; Western blot). (H) The relative expressions of MMP2 and MCP-1. Data were expressed as mean ± SD, * P")

, TGF-β1 (10 ng/mL) and HG + TGF-β1 (22 mmol/L, 10 ng/mL). (D–F) Image J software was used to collect the gray value of protein bands. *p")
 Representative blots. Full images of the Western blot are in the Supplementary Material (Figures S13–S16). (b) Western blot analysis of MLCK, cleaved caspase-3, α-SMA, and DDAH1. The intensity of bends was normalized to the intensity of β-actin bends in the corresponding samples. One-way ANOVA followed by Tukey’s multiple comparisons test,")
 Schematic illustration of 0.1 % DDC-induced cholestatic liver injury. (b) Pathological changes of liver. (c–e) The changes of body weight, liver weight, and liver index. (f–g) The changes of serum AST and ALT. (h-l) HE, PSR, α-SMA, ROS, and BRG1 changes of liver. (m–n) Quantitative analysis of PSR and BRG1. Data are shown as means ± SD (n = 3). #P < 0.05, ##P < 0.01, ###P < 0.001 compared with Control group. ⁎P < 0.05, ⁎⁎P < 0.01, ⁎⁎⁎P < 0.001 compared with DDC 1W group.")
 Expression of ANO1 in cancer cells. (B) Expression of FAP in CAFs. (C) Expression of α-SMA in CAFs. (D) Expression of CD8 in TILs. (E) Expression of FOXP3 in TILs. Scale bar = 100 µm. ANO1, aminooctylamine; FAP, fibroblast activation protein; CAF, cancer-associated fibroblast; α-SMA, alpha smooth muscle actin; TIL, tumor-infiltrating lymphocyte; FOXP3, forkhead box protein 3.")
 Immunofluorescence identification of corpus cavernosum endothelial cells (CCECs) cells, green fluorescence is positive for membrane CD31 (image scales: 20 × 100, 40 × 50 µm) and VWF (image scales: 100 × 20 µm) expression, blue fluorescence is DAPI cell nuclear staining; (B) immunofluorescence identification of corpus cavernosum smooth muscle cells (CCSMCs) cells, green fluorescence is positive for membrane α-SMA (image scales: 20 × 100, 40 × 50 µm) expression, blue fluorescence is DAPI cell nuclear staining")
 Effect of Biejiaxiaozheng pills on the viability of LX-2 cells. (B) Effect of Biejiaxiaozheng pills on the Viability of TGF-β-induced activation model of LX-2 cells. (C) Effect of Biejiaxiaozheng pills on the fibrosis-related proteins Expression of LX-2 cells.")
 and MLg (D,E) cells were exposed to oleuropein and/or TGF-β1 (5 ng/mL) for 24 h, after which samples were collected for Western blot analysis to assess the protein expression levels of collagen I, fibronectin, and α-SMA (original images can be found in Figure S1). NIH-3T3 (C) and MLg (F) cells were similarly treated, and samples were collected for real-time quantitative PCR to evaluate the RNA levels of collagen I, fibronectin, and α-SMA. The data are presented as Mean ± SD (one-way ANOVA with Tukey’s post hoc multiple comparison tests), n = 3. # indicates differences between the control group and the TGF-β1 group, with # p < 0.05, ## p < 0.01, ### p < 0.001, and #### p < 0.0001. * indicates differences between the TGF-β1 group and the oleuropein treatment groups, with * p < 0.05, ** p < 0.01, *** p < 0.001, and **** p < 0.0001.")
 Renal histology by H&E and PAS staining (scale bar = 20 µm); (C) Masson staining to observe the degree of renal fibrosis and (D) semi-quantitative analysis using ImageJ software; (E-G) Semiquantitative analysis of the relative expression levels of COI-I and α-SMA in renal tissues using IHC and ImageJ software (scale bar = 20 µm). Abbreviations: YHT = yinhuo Tang; DKD = diabetic kidney disease; H&E = Hematoxylin and Eosin stain; PAS = Periodic Acid-Schiff stain; COI-I = Collagen type I; α-SMA = α-smooth muscle actin; CON = control group; MOD = model group; POS = valsartan Positive control group; YH-L = low-dose group of the YHT; YH-M = middle-dose group of the YHT; YH-H = high-dose group of the YHT.")
. C Measurement of TNF-alpha concentration in serum using the Mouse TNF-alpha ELISA Kit on days 28 and 56. D Changes in HYP content in lung tissues of each group on days 28 and 56. Data are presented as mean ± SD, n = 5 per group. (C: control group; M: model group; E: exosome group; H: stem cell group. *P")
 Cel greatly increased the expression of SIRT1, PGC-1α, Nrf2, NQO1, HO-1, and SOD-1, and decreased the expression of NOX4. (B) Statistical analysis of relative protein expressions of SIRT1, PGC-1α, Nrf2, NOX4, NQO1, HO-1, and SOD-1. (C) Cel significantly decreased the expression of TGF-β1, TGF-βRII, Smad2/3, P-Smad2/3, α-SMA, COL I, and FN. (D) Statistical analysis of relative protein expressions of TGF-β1, TGF-βRII, Smad2/3, P-Smad2/3, α-SMA, COL I, and FN. The Western blot results were presented as mean ± SD of three independent experiments. *P < 0.05, **P < 0.01, ***P < 0.001, comparison between two groups.")
, mean blood pressure (B), and diastolic blood pressure (C). Kits was used to detected 24 h urinary protein (D), Scr (E), and BUN (F); (G) Masson staining was used to observe collagen fibers deposition with a scale of 50 μm; (H) Western blot was used to detect α-SMA and collagen I expression. **p < 0.01 VS Control, ##p < 0.01 VS Ang II, ^^p < 0.01 VS Ang II + Low SJZT. n = 5.")
 Masson’s trichrome staining and HE is staining of peritoneal tissue sections (×400). (b) Immunohistochemical staining of SOCS1, α-SMA, and Collagen I in peritoneal tissue sections (×400). (c) Expression levels of TGF-β, Smad2/3, p-Smad2/3, and SOCS1 were detected using protein blotting. Each group contained eight rats, and three fields of view were randomly selected for each group. The percentage of the stained area was calculated for statistical analysis. All immunoblotting experiments were performed independently and repeated at least three times. Values are expressed as mean ± standard deviation. *p < 0.05 vs. Control; **p < 0.01 vs. Control; ***p < 0.001 vs. Control.")
 for 24 hours. The protein expression levels of α-SMA, CTGF, collagen I, collagen III and FN in fibroblasts were analyzed by Western blot (A–F). Data are expressed with mean ± SD; (B–F), *p < 0.05: Hypoxia group vs Control group, &p < 0.05: si-SPP1 group vs Hypoxia group, ns, Negative control group vs Hypoxia group. All experiments were repeated three times independently.")
 Morphology. (B) HE staining (400×). (C) Masson staining (400×). Scale bar is 20 μm. (D) Protein expression levels of α-SMA and collagen I in mouse livers. (E) mRNA expression level of α-SMA and collagen Ⅰ in mouse livers. Compared with the control group, **p < 0.01.")
 Liver appearance. (B) HE staining of liver tissues. Scale bar = 100 μm. (C and F) Masson staining of collagen fibers in liver tissues and quantification analysis of the collagen fibers area. Scale bar = 100 μm. (D and G) Sirius red staining of collagen fibers in liver tissues and quantification analysis of the collagen fibers area. Scale bar = 100 μm. (E and H) IHC staining of collagen I in liver tissues and quantification analysis of the collagen I area. Scale bar = 100 μm. (I and J) Western blot of Collagen I, Fibronectin and α-SMA and quantitative analysis of the relative protein expressions. (K) Serum AST level. (L) Serum ALT level. ## p")
 in long-term PD patients with peritoneal fibrosis. (a) Heatmap showing differential gene expression in PMCs from 1W-PD and 1Y-PD patients. (b) Representative immunofluorescence images of staining for POSTN, NF-κB P65, p-P65, CXCL8, α-smooth muscle actin (α-SMA), collagen I (Col-1), transforming growth factor-β (TGF-β), and FN in PMCs from 1W-PD and 1Y-PD patients. Scale bar = 50 µm. (c–i) mRNA expression levels in the two groups. (j–o) Representative Western blot images and quantitative analysis of POSTN, p-P65/P65, CXCL8, α-SMA, and Col-1 expression in the two groups.")
 The relative gene expression of COL1A1 and TIMP1 in si-BAG2-treated keloid fibroblasts compared to control groups. Gene expression related to collagen synthesis and the inhibition of collagen degradation was significantly reduced following BAG2 inhibition; (B) Western blot analysis showing reduced protein expression of BAG2, COL1, COL3, and α-SMA in si-BAG2-treated keloid fibroblasts; (C) Masson’s trichrome staining of keloid explants from different groups. Collagen structures in the si-BAG2-treated groups appeared thinner compared to control groups; (D) Western blot analysis demonstrates decreasing protein expression of COL1 and COL3 in si-BAG2-treated ex-vivo keloid explants. The reduction in COL1 and COL3 protein expression was statistically significant. Statistical analysis of relative protein expression is provided (n=3). **P")
 Use CD55-carrying lentivirus to infect CT26 cells. Add 1 × 10⁴/well cells to a 96-well plate. Use the CCK8 method to measure the absorbance at 450 nm for 2 h, 4 h, 24 h, and 48 h. Use an empty virus as a control. (C) Repeat the above experiment using the Edu method. (D) Use CD55-carrying lentivirus to infect CT26 cells. Evenly place 200 cells in a small dish. Stain with Giemsa 2 weeks later and observe the results. (E) Use CD55-carrying lentivirus to infect CT26 cells. Add the cells to a small dish to ensure 5 × 10⁵/dish. On the second day, a horizontal line was drawn in each well with a pipette tip, and the cells were observed and photographed under a microscope 24 h later. (F) 1 × 10⁴/well was added to the upper chamber of the Transwell chamber, and crystal violet was used to stain and photographed 24 h later. (G, H) CT26 cells were infected with CD55 lentivirus, and the expression of EMT-related proteins was detected by Western Blot. GAPDH was used as an internal reference to analyze the relative gray value. The above experiments involved the sampling of quantitative data with mean ± SEM, and Student’s t-test was used for statistical analysis. At least three replicates were required for each group. P")
 Expression of TBC1D1 in cancer cells. (B) Expression of FAP in CAFs. (C) Expression of a-SMA in CAFs. (D) Expression of CD8 in TILs. (E) Expression of FOXP3 in TILs. (F) Expression of PD-1 in T cells. (G) Expression of PD-L1 in cancer cells. α-SMA, Alpha smooth muscle Actin; CD8, Clusters of differentiation 8T cells; FAP, Fibroblast activation protein; FOXP3, Forkhead box protein 3; PD-1, programmed cell death protein 1; PD-L1, programmed cell death ligand-1; TBC1D1, TBC1 domain family member 1.")
 UMAP plots of LC cluster. Cells are colored according to the expression level of specific gene. (B) Masson's staining of mice testis tissue transfected with CCN5 overexpression or control plasmids. The scale bar represents 50 μm. (C) Western blot shows the dynamic change of α-SMA (ACTA2) protein in LCs after recombinant CCN5 protein incubation. n = technical repeats. (D) Heatmap shows the expression pattern of WNT signal related genes in LCs with CCN5(ΔSP) overexpression or recombinant CCN5 protein incubation. Genes with significant change are listed. Statistical analysis made by 2-tailed, ANOVA test; the confidence interval is 95%. (E) Immunofluorescence of β-catenin in cultured LCs with CCN5(ΔSP) overexpression, CCN5(wt) overexpression, or recombinant CCN5 protein incubation. The bottom panel is a local magnification of the top panel. The scale bar represents 10 μm (bottom panel) and 20 μm (top panel). n = 15 cells. (F) GSEA with the DEGs of LCs after recombinant CCN5 protein incubation. (G) Western blot shows the dynamic change of SMAD signal proteins in LCs after recombinant CCN5 protein incubation. n = technical repeats. (H) Western blot shows the expression level of SMAD signal proteins in LCs with or without recombinant CCN5 protein incubation and XAV939.")
. B Intergroup comparison of α-SMA integrated optical density (IOD) (n = 6). ***P")
 Representative images of Masson-stained lung sections (scale bar: 100 μm) with quantitative analysis of collagen deposition. Green dashed lines outline areas of collagen accumulation, and green arrows indicate airway wall thickening caused by extracellular matrix remodeling. Collagen deposition is a percentage of the total tissue area (mean ± SD). (C–F) Western blot analysis of EMT-associated proteins (Vimentin, E-Cadherin, α-SMA) in lung tissue samples. Protein expression levels were normalized to GAPDH and are shown as fold changes relative to sham controls (mean ± SD). (G) Immunofluorescence staining of E-cadherin and α-SMA in lung tissues (scale bar: 100 μm). (H–I) Quantification of E-cadherin intensity and α-SMA intensity (RFU). N = 8 mice group. ###p")
 Representative images of Masson-stained lung sections (scale bar: 100 μm) with quantitative analysis of collagen deposition. Green dashed lines outline areas of collagen accumulation, and green arrows indicate airway wall thickening caused by extracellular matrix remodeling. Collagen deposition is a percentage of the total tissue area (mean ± SD). (C–F) Western blot analysis of EMT-associated proteins (Vimentin, E-Cadherin, α-SMA) in lung tissue samples. Protein expression levels were normalized to GAPDH and are shown as fold changes relative to sham controls (mean ± SD). (G) Immunofluorescence staining of E-cadherin and α-SMA in lung tissues (scale bar: 100 μm). (H–I) Quantification of E-cadherin intensity and α-SMA intensity (RFU). N = 8 mice group. ###p")
 Nrf2−/− mice genotype identification. (B) Protein bands and analysis of Nrf2 in mice mammary tissue. (C) Expression of COL1, α-SMA, Vim mRNA in mammary tissue. (D-G) Protein bands and analysis of E-cad, α-SMA, Vim and β-actin in mice mammary tissue. (H-I) Results of immunofluorescence staining and analysis of mammary tissue with α-SMA, 200 μm. The data were presented as Mean ± SD. There were 6 mice in each group (n = 6). Three independent repeatable experiments were performed. ** represents P")
 Nrf2−/− mice genotype identification. (B) Protein bands and analysis of Nrf2 in mice mammary tissue. (C) Expression of COL1, α-SMA, Vim mRNA in mammary tissue. (D-G) Protein bands and analysis of E-cad, α-SMA, Vim and β-actin in mice mammary tissue. (H-I) Results of immunofluorescence staining and analysis of mammary tissue with α-SMA, 200 μm. The data were presented as Mean ± SD. There were 6 mice in each group (n = 6). Three independent repeatable experiments were performed. ** represents P")
 qRT-PCR analysis of METTL3 expression in VSMCs overexpressing METTL3. (B) Western blot analysis confirming METTL3 overexpression in VSMCs. (C) Western blot analysis showing the expression levels of AMPK, p-AMPK, α-SMA, and SM22α. (D–E) qRT-PCR results demonstrating the mRNA expression levels of α-SMA and SM22α. (F) Immunofluorescence staining of α-SMA and SM22α in VSMCs (scale bar = 25 μm). (G-L) qRT-PCR analysis of IL-1β, IL-6, TNF-α, iNOS, MMP-3, and MMP-9 expression in VSMCs. Each experiment was conducted at least three times. Error bars indicate mean ± SD. Statistical significance was determined by one-way ANOVA: *P")
 Images of immunofluorescence staining for CD163 (green), CD86 (green), and F4/80 (red) in the aorta. The scale bar in the figure is 200 μm. (B) Percentage of CD86+ and CD163+ macrophages. n = 3. (C) Expression of CD86 and CD163 in the aorta was revealed by western blot. (D) Qualification of CD86+ and CD163+. n = 3. (E) Images of immunofluorescence staining for α-SMA (green) and F4/80 (red) in the aorta. The scale bar in the figure is 300 μm, and the image in the right frame is a ×400 magnification of the point pointed. n = 3. (F) Percentage of F4/80+α-SMA+ cells. n = 3. (G) Expression of NF-κB p65, NF-κB pp65, NLRP3, and Caspase-1 p20 in the aorta by western blot. (H) Qualification of NF-κB p65, NF-κB pp65, NLRP3, and Caspase-1 p20. n = 3. Multi-group comparison was measured by one-way ANOVA. The data are presented as the mean ± SD. *p")
产品描述
*The optimal dilutions should be determined by the end user. For optimal experimental results, antibody reuse is not recommended.
*Tips:
WB: 适用于变性蛋白样本的免疫印迹检测. IHC: 适用于组织样本的石蜡(IHC-p)或冰冻(IHC-f)切片样本的免疫组化/荧光检测. IF/ICC: 适用于细胞样本的荧光检测. ELISA(peptide): 适用于抗原肽的ELISA检测.
引用格式: Affinity Biosciences Cat# AF1032, RRID:AB_2835329.
展开/折叠
a actin; AAT6; ACTA_HUMAN; ACTA2; Actin alpha 2 smooth muscle aorta; Actin aortic smooth muscle; Actin, aortic smooth muscle; ACTSA; ACTVS; Alpha 2 actin; Alpha actin 2; Alpha cardiac actin; Alpha-actin-2; Cell growth inhibiting gene 46 protein; Cell growth-inhibiting gene 46 protein; GIG46; Growth inhibiting gene 46; MYMY5; Sarcomeric Actin;
抗原和靶标
A synthesized peptide derived from human alpha-SMA, corresponding to a region within N-terminal amino acids.
研究领域
· Environmental Information Processing > Signal transduction > Apelin signaling pathway. (View pathway)
· Organismal Systems > Circulatory system > Vascular smooth muscle contraction. (View pathway)
· Organismal Systems > Endocrine system > Relaxin signaling pathway.
文献引用

Application: IHC Species: Human Sample:

Application: WB Species: mouse Sample: liver

Application: WB Species: Mouse Sample:

Application: IF/ICC Species: Mouse Sample:

Application: IHC Species: Mouse Sample:

Application: IHC Species: Mouse Sample:
Application: WB Species: Mice Sample: fibrogenesis
Application: IF/ICC Species: Mice Sample: fibrogenesis

Application: WB Species: Mouse Sample:

Application: IF/ICC Species: Mouse Sample:
限制条款
产品的规格、报价、验证数据请以官网为准,官网链接:www.affbiotech.com | www.affbiotech.cn(简体中文)| www.affbiotech.jp(日本語)产品的数据信息为Affinity所有,未经授权不得收集Affinity官网数据或资料用于商业用途,对抄袭产品数据的行为我们将保留诉诸法律的权利。
产品相关数据会因产品批次、产品检测情况随时调整,如您已订购该产品,请以订购时随货说明书为准,否则请以官网内容为准,官网内容有改动时恕不另行通知。
Affinity保证所销售产品均经过严格质量检测。如您购买的商品在规定时间内出现问题需要售后时,请您在Affinity官方渠道提交售后申请。产品仅供科学研究使用。不用于诊断和治疗。
产品未经授权不得转售。
Affinity Biosciences将不会对在使用我们的产品时可能发生的专利侵权或其他侵权行为负责。Affinity Biosciences, Affinity Biosciences标志和所有其他商标所有权归Affinity Biosciences LTD.