产品: xCT 抗体
货号: DF12509
描述: Rabbit polyclonal antibody to xCT
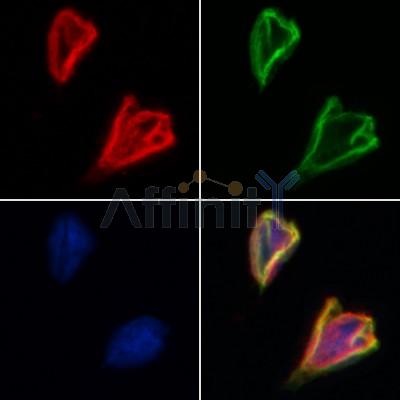
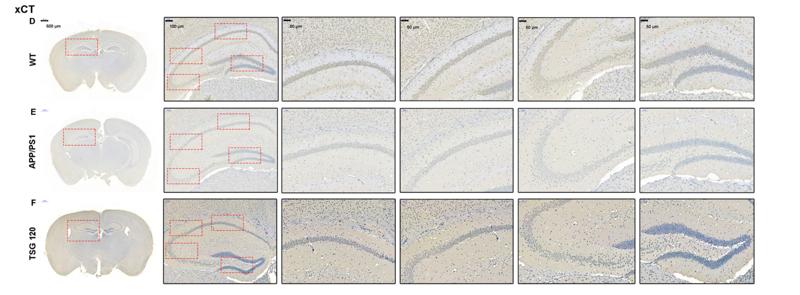
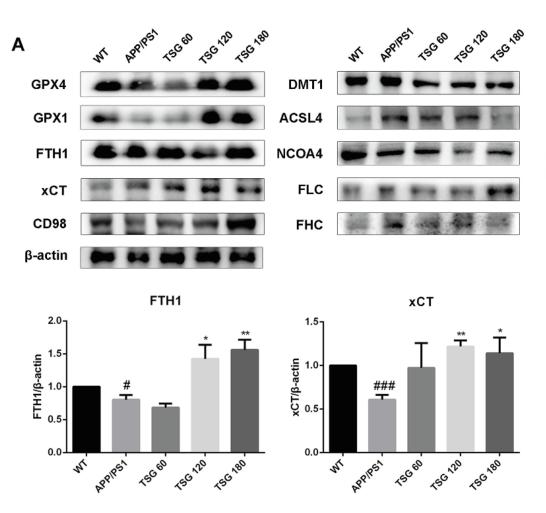
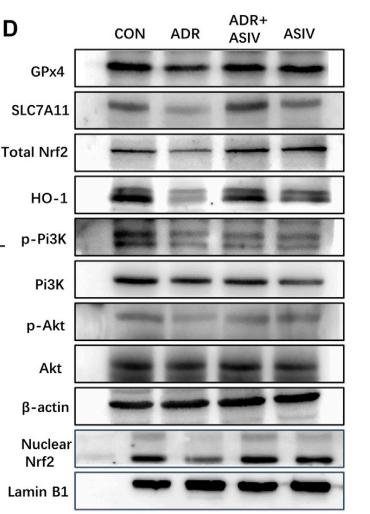
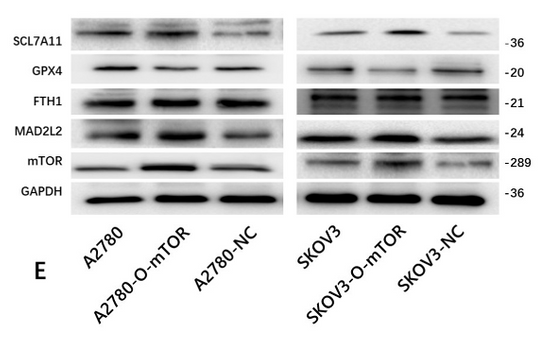
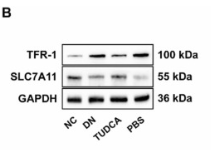
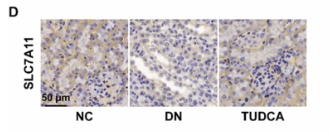
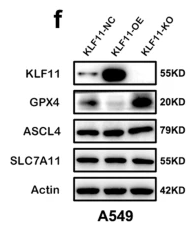
应用: WB IHC IF/ICC
文献验证: WB, IHC, IF/ICC
反应: Human, Mouse, Rat, Monkey
预测: Pig, Horse, Rabbit, Dog
分子量: 37 kDa; 55kD(Calculated).
蛋白号: Q9UPY5
RRID: AB_2845314

浏览相似产品>>

   规格 价格 库存
 50ul RMB¥ 1250 现货
 100ul RMB¥ 2300 现货
 200ul RMB¥ 3000 现货

货期: 当天发货

联系销售

产品描述

来源:
Rabbit
应用:
WB 1:500-1:2000, IHC 1:50-1:200, IF/ICC 1:100-1:500
*The optimal dilutions should be determined by the end user.
*Tips:

WB: 适用于变性蛋白样本的免疫印迹检测. IHC: 适用于组织样本的石蜡(IHC-p)或冰冻(IHC-f)切片样本的免疫组化/荧光检测. IF/ICC: 适用于细胞样本的荧光检测. ELISA(peptide): 适用于抗原肽的ELISA检测.

反应:
Human, Mouse, Rat, Monkey
预测:
Pig(93%), Horse(%), Rabbit(%), Dog(%)
克隆:
Polyclonal
特异性:
xCT Antibody detects endogenous levels of total xCT.
RRID:
AB_2845314
引用格式: Affinity Biosciences Cat# DF12509, RRID:AB_2845314.
偶联:
Unconjugated. 130
纯化:
The antiserum was purified by peptide affinity chromatography using SulfoLink™ Coupling Resin (Thermo Fisher Scientific).
保存:
Rabbit IgG in phosphate buffered saline , pH 7.4, 150mM NaCl, 0.02% sodium azide and 50% glycerol. Store at -20 °C. Stable for 12 months from date of receipt.
别名:

展开/折叠

Amino acid transport system xc xCT antibody; Amino acid transport system xc-; Calcium channel blocker resistance protein CCBR1; Calcium channel blocker resistance protein CCBR1 antibody; CCBR1; Cysteine/glutamate transporter antibody; Cystine/glutamate transporter; OTTHUMP00000164578; SLC7A11; Solute carrier family 7 (anionic amino acid transporter light chain, xc- system), member 11; solute carrier family 7; Solute carrier family 7 member 11; Solute carrier family 7, (cationic amino acid transporter, y+ system) member 11; SYSTEM Xc(-) TRANSPORTER-RELATED PROTEIN; xCT; XCT_HUMAN;

抗原和靶标

免疫原:
Uniprot:
基因/基因ID:
序列:
MVRKPVVSTISKGGYLQGNVNGRLPSLGNKEPPGQEKVQLKRKVTLLRGVSIIIGTIIGAGIFISPKGVLQNTGSVGMSLTIWTVCGVLSLFGALSYAELGTTIKKSGGHYTYILEVFGPLPAFVRVWVELLIIRPAATAVISLAFGRYILEPFFIQCEIPELAIKLITAVGITVVMVLNSMSVSWSARIQIFLTFCKLTAILIIIVPGVMQLIKGQTQNFKDAFSGRDSSITRLPLAFYYGMYAYAGWFYLNFVTEEVENPEKTIPLAICISMAIVTIGYVLTNVAYFTTINAEELLLSNAVAVTFSERLLGNFSLAVPIFVALSCFGSMNGGVFAVSRLFYVASREGHLPEILSMIHVRKHTPLPAVIVLHPLTMIMLFSGDLDSLLNFLSFARWLFIGLAVAGLIYLRYKCPDMHRPFKVPLFIPALFSFTCLFMVALSLYSDPFSTGIGFVITLTGVPAYYLFIIWDKKPRWFRIMSEKITRTLQIILEVVPEEDKL

种属预测

种属预测:

score>80的预测可信度较高,可尝试用于WB检测。*预测模型主要基于免疫原序列比对,结果仅作参考,不作为质保凭据。

Species
Results
Score
Pig
93
Horse
93
Dog
93
Rabbit
93
Xenopus
79
Chicken
77
Zebrafish
64
Bovine
0
Sheep
0
Model Confidence:
High(score>80) Medium(80>score>50) Low(score<50) No confidence

研究背景

功能:

Sodium-independent, high-affinity exchange of anionic amino acids with high specificity for anionic form of cystine and glutamate.

细胞定位:

Membrane>Multi-pass membrane protein.

Extracellular region or secreted Cytosol Plasma membrane Cytoskeleton Lysosome Endosome Peroxisome ER Golgi apparatus Nucleus Mitochondrion Manual annotation Automatic computational assertionSubcellular location
亚基结构:

Disulfide-linked heterodimer with the amino acid transport protein SLC3A2/4F2hc.

蛋白家族:

Belongs to the amino acid-polyamine-organocation (APC) superfamily. L-type amino acid transporter (LAT) (TC 2.A.3.8) family.

研究领域

· Cellular Processes > Cell growth and death > Ferroptosis.   (View pathway)

文献引用

1). Exosomes secreted from cardiomyocytes suppress the sensitivity of tumor ferroptosis in ischemic heart failure. Signal transduction and targeted therapy, 2023 (PubMed: 36967385) [IF=40.8]

2). Polyamine-mediated ferroptosis amplification acts as a targetable vulnerability in cancer. Nature communications, 2024 (PubMed: 38504107) [IF=16.6]

3). FOXO1-NCOA4 Axis Contributes to Cisplatin-Induced Cochlea Spiral Ganglion Neuron Ferroptosis via Ferritinophagy. Advanced science (Weinheim, Baden-Wurttemberg, Germany), 2024 (PubMed: 39206719) [IF=15.1]

4). Metabolomic and Cellular Mechanisms of Drug-Induced Ototoxicity and Nephrotoxicity: Therapeutic Implications of Uric Acid Modulation. Advanced science (Weinheim, Baden-Wurttemberg, Germany), 2025 (PubMed: 40041973) [IF=15.1]

5). Internalized polystyrene nanoplastics trigger testicular damage and promote ferroptosis via CISD1 downregulation in mouse spermatocyte. JOURNAL OF NANOBIOTECHNOLOGY, 2025 [IF=12.6]

Application: WB    Species: Mouse    Sample: GC-2 cells

Fig. 3 PS-NPs initiate ferroptosis by triggering iron overload and ROS overproduction in GC-2 cells. (A) Various concentrations of PS-NPs (50 µg/mL, 100 µg/mL, 200 µg/mL) in different treatment times (6–24 h) reduce cell viability in GC-2 cells. (B and C) Representative images and quantification of fluorescence intensity for lipid peroxidation levels labelled with C11 BODIPY in GC-2 cells post-exposed with PS-NPs. Statistical analysis presented the ratio of MFI of green to red. (D-F) The levels of MDA, GSH, and total Fe were detected in GC-2 cells after PS-NPs treatment for 12 h. (G and H) Representative images and quantification of fluorescence intensity showing intracellular chelatable iron in GC-2 cells post-exposure to PS-NPs labelled with FerroOrange (red). (I and J) DCFH-DA staining was performed to detect ROS levels of GC-2 cells after PS-NPs exposure for 12 h using fluorescent microscopy. (K) Flow cytometry analysis of and ROS levels of GC-2 cells after PS-NPs exposure for 12 h using Fluorescence-activated cell sorting (FACS). (L) qRT-PCR analysis of ferroptosis-related gene expression in GC-2 cells treated with or without PS-NPs. (M and N) Ferroptosis-related proteins in GC-2 cells stimulated by PS-NPs were determined by western blotting. And semi-quantification of protein expression levels normalized to β-actin. (O) Representative TEM images depicting mitochondria in GC-2 cells in response to exposure to PS-NPs. The reduction of mitochondrial cristae is denoted by yellow arrows, while red arrows signify mitochondrial membrane rupture. (P and Q) Representative illustration and quantification of fluorescence intensity depicting mitochondria in GC-2 cells after treatment with PS-NPs using Mito-Tracker Green. (R and S) Illustration and quantification data of mitochondrial membrane potential in GC-2 cells in response to treatment of PS-NPs stained with TMRE

Application: IF/ICC    Species: Mouse    Sample: GC-2 cells

Fig. 3 PS-NPs initiate ferroptosis by triggering iron overload and ROS overproduction in GC-2 cells. (A) Various concentrations of PS-NPs (50 µg/mL, 100 µg/mL, 200 µg/mL) in different treatment times (6–24 h) reduce cell viability in GC-2 cells. (B and C) Representative images and quantification of fluorescence intensity for lipid peroxidation levels labelled with C11 BODIPY in GC-2 cells post-exposed with PS-NPs. Statistical analysis presented the ratio of MFI of green to red. (D-F) The levels of MDA, GSH, and total Fe were detected in GC-2 cells after PS-NPs treatment for 12 h. (G and H) Representative images and quantification of fluorescence intensity showing intracellular chelatable iron in GC-2 cells post-exposure to PS-NPs labelled with FerroOrange (red). (I and J) DCFH-DA staining was performed to detect ROS levels of GC-2 cells after PS-NPs exposure for 12 h using fluorescent microscopy. (K) Flow cytometry analysis of and ROS levels of GC-2 cells after PS-NPs exposure for 12 h using Fluorescence-activated cell sorting (FACS). (L) qRT-PCR analysis of ferroptosis-related gene expression in GC-2 cells treated with or without PS-NPs. (M and N) Ferroptosis-related proteins in GC-2 cells stimulated by PS-NPs were determined by western blotting. And semi-quantification of protein expression levels normalized to β-actin. (O) Representative TEM images depicting mitochondria in GC-2 cells in response to exposure to PS-NPs. The reduction of mitochondrial cristae is denoted by yellow arrows, while red arrows signify mitochondrial membrane rupture. (P and Q) Representative illustration and quantification of fluorescence intensity depicting mitochondria in GC-2 cells after treatment with PS-NPs using Mito-Tracker Green. (R and S) Illustration and quantification data of mitochondrial membrane potential in GC-2 cells in response to treatment of PS-NPs stained with TMRE

6). Retinol Saturase Mediates Retinoid Metabolism to Impair a Ferroptosis Defense System in Cancer Cells. Cancer research, 2023 (PubMed: 37184371) [IF=12.5]

7). ZnO NPs induce miR-342-5p mediated ferroptosis of spermatocytes through the NF-κB pathway in mice. Journal of nanobiotechnology, 2024 (PubMed: 38961442) [IF=10.2]

8). EBF1-induced CSRP2 boosts the progression of B-cell acute lymphocytic leukemia by inhibiting ferroptosis. Cancer letters, 2025 (PubMed: 39952599) [IF=9.1]

9). FGF2 Alleviates Microvascular Ischemia-Reperfusion Injury by KLF2-mediated Ferroptosis Inhibition and Antioxidant Responses. International journal of biological sciences, 2023 (PubMed: 37705747) [IF=8.2]

Application: WB    Species: Mouse    Sample:

Figure 4 FGF2 reduces I/R-induced ferroptosis in ECs. (A) Heatmap displays the PBS and I/R cohorts' distinctive abundance characteristics. (B) The KEGG database's functional classification of the FGF2-regulated genes. (C) WB assay of GPX4, 4-HNE, and SLC7A11 in skeletal muscle tissues. (D) Quantification of protein level of SLC7A11, 4-HNE and GPX4 from (C) with normalised to GAPDH band density. (E) WB assay of GPX4, 4-HNE, and SLC7A11 in skeletal muscle samples. (F) Skeletal muscle slices with GPX4 and CD31, an EC marker, stained. DAPI staining is used to identify the nuclei. Scale bars: 100 μm. (G) Quantification of protein level of SLC7A11, 4-HNE and GPX4 from (E) with normalized with respect to GAPDH band density. (H) Quantification of GPX4 and CD31 double-positive cells, the percentages of double positive cells versus total CD31 positive cells are indicated. (I) Content of Fe2+ was plotted as a histogram. (J) A histogram displaying the MDA content. (K) Content of GSH was plotted as a histogram. (L) Sections of skeletal muscle stained with 4-HNE, with DAPI staining identifying the nuclei. Scale bars: 100 μm. Based on the immunofluorescence results in (L), the average 4-HNE optical density is shown in (M). Data are presented as mean ± SD (n = 3-5 per group). Significance: *P < 0.05.

10). PM2.5 caused ferroptosis in spermatocyte via overloading iron and disrupting redox homeostasis. The Science of the total environment, 2023 (PubMed: 36781135) [IF=8.2]

加载更多

限制条款

产品的规格、报价、验证数据请以官网为准,官网链接:www.affbiotech.com | www.affbiotech.cn(简体中文)| www.affbiotech.jp(日本語)

产品的数据信息为Affinity所有,未经授权不得收集Affinity官网数据或资料用于商业用途,对抄袭产品数据的行为我们将保留诉诸法律的权利。

产品相关数据会因产品批次、产品检测情况随时调整,如您已订购该产品,请以订购时随货说明书为准,否则请以官网内容为准,官网内容有改动时恕不另行通知。

Affinity保证所销售产品均经过严格质量检测。如您购买的商品在规定时间内出现问题需要售后时,请您在Affinity官方渠道提交售后申请。

产品仅供科学研究使用。不用于诊断和治疗。 

产品未经授权不得转售。

Affinity Biosciences将不会对在使用我们的产品时可能发生的专利侵权或其他侵权行为负责。Affinity Biosciences, Affinity Biosciences标志和所有其他商标所有权归Affinity Biosciences LTD.